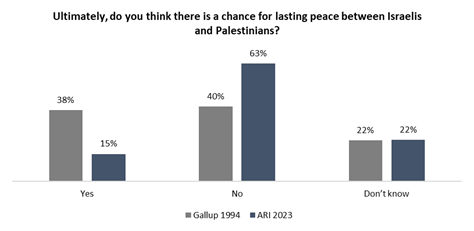
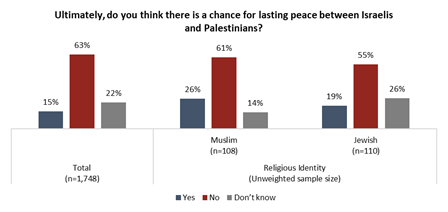
|
BUSINESS
& POLITICS IN THE WORLD GLOBAL
OPINION REPORT NO. 817-821 Week: October 16 – November
19, 2023 Presentation: November 24,
2023 817-821-43-37/Commentary:
Most Britons Have Sympathy For Both Sides In Israel-Palestine Conflict Japanese
Unimpressed With Stimulus Steps, Kishida's Ratings Hit Low—Poll 58%
Of Pakistanis Feel That Unemployment In Pakistan Will Worsen In The Next 6
Months Population
Of Pakistan Reaches 241.5 Million, With An Average Yearly Increase Of 2.55%
Since 2017 Food
Security Poll: 7 In 10 Adult Nigerians Often Go Hungry Due To Insufficient
Food Mozambicans
Call For Tighter Governmental Regulations To Protect The Environment One
Year On, Has Rishi Sunak Won Back Lost 2019 Tory Voters Britons
Lack Confidence That AI Can Be Developed And Regulated Responsibly Undecided
Conservatives Still Lean Towards The Party Most
Britons Have Sympathy For Both Sides In Israel-Palestine Conflict The
Death Of Business Attire? Just 7% Of Workers Wear A Suit To Work Eight
In Ten Britons Say Public Services Have Got Worse Over The Past 5 Years What
Do The French Think Of Napoleon? 44%
Of Companies Struggle To Recruit Generation Z Talent Only
1 In 4 French Companies Know Exactly About Invoicing Reform Annual
Observatory On Psychological Well-Being In Italian Companies Poll
Shows Biden Support Slumping Among Michigan Muslims Palestinians
In Gaza At Risk Before Israel-Hamas War Majority
Now Say U.S. Losing Ground On Illegal Drug Problem 81%
Of U.S. Adults – Versus 46% Of Teens – Favor Parental Consent For Minors To
Use Social Media About
1 In 5 U.S. Teens Who’ve Heard Of Chatgpt Have Used It For Schoolwork Majority
— Including Two-In-Five Past Liberal Voters — Say Trudeau Should Step Down Israel-Gaza:
Canadians Share Sympathies With Both Sides In Warzone, Two-Thirds Call For
Ceasefire October
2023: Consumer Confidence Declines Sharply Across Southeast Asia, A 29
Country-Survey Survey
Across 142 Countries Tells Almost A Quarter Of The World Feels Lonely Most
Countries Don’t Observe Daylight Saving Time, A Survey Across 193 Nations Comparing
Views Of The U.S. And China In 24 Countries INTRODUCTORY NOTE
817-821-43-37/Commentary:
Most Britons Have Sympathy For Both Sides
In Israel-Palestine Conflict
Those who tend to take a side are split in whether
or not they have sympathy for the other side, however YouGov has been tracking
attitudes towards the Israel-Palestine conflict since before the recent
outbreak of fighting. Our latest tracker results
show that 19% of Britons say they ‘most sympathise’ with the Israeli side,
while an identical 19% say they most sympathise with the Palestinian side. A
further 31% sympathise with both sides equally, while the remaining 31% are
unsure.
A new survey looks into
these attitudes in more depth, asking Britons to subsequently say how much
sympathy they have for either side in the conflict. The four in ten Britons
who express a tendency to support one side more than the other are split on
whether they also hold some sympathy for the other side. Among those with a
more pro-Israeli view, 49% say they sympathise at least somewhat with the
Palestinians. Likewise, 54% of those with a more pro-Palestinian stance say
they have at least some sympathy for the Israelis. However, 44-46% of those
who sympathise with one side more than the other say they “don’t sympathise
at all” with the other side.
Looking at the British
public as a whole, 56% express at least some sympathy for both sides,
including 15% who say they sympathise a great deal with those on either side
of the conflict. Only 3% have no sympathy for either – 8% sympathise solely
with the Israelis and an additional 9% sympathise only with the Palestinians.
(YouGov UK) 06 November, 2023 SUMMARY OF POLLS ASIA (Japan) Japanese Unimpressed With
Stimulus Steps, Kishida's Ratings Hit Low—Poll Nearly two-thirds of
Japanese are not impressed with the government’s new economic stimulus
measures as support for Prime Minister Fumio Kishida slipped to its lowest
yet, a Kyodo news poll found on Sunday. Support for Kishida’s cabinet fell
4.0 percentage points from three weeks earlier to 28.3%, its lowest in the
Kyodo survey since he took office in October 2021, and in line with other
recent surveys. His disapproval rating rose 4.2 points to 56.7% in the survey
conducted from Friday to Sunday. (Asahi Shimbun) 06 November, 2023 (Pakistan) 58% Of Pakistanis Feel That
Unemployment In Pakistan Will Worsen In The Next 6 Months According to a survey
conducted by Gallup & Gilani Pakistan and Dun & Bradstreet Pakistan,
58% of Pakistanis feel that unemployment in Pakistan will worsen in the next
6 months. Only 18% optimistic that unemployment will get better. A nationally
representative sample of adult men and women from across the country was
asked the question, “In your opinion, in next 6 months, unemployment in
Pakistan will be…?” In response, 3% said ‘much better’, 15% said ‘better’,
16% said ‘same as before’, 31% said ‘worse’, 27% said ‘much worse’, and 8%
said that they did not know or gave no response. (Gallup Pakistan) 08 November, 2023 Population Of Pakistan Reaches
241.5 Million, With An Average Yearly Increase Of 2.55% Since 2017 Gallup Pakistan recently
conducted an analysis of the results of the 7th Population & Housing
Census 2023. Some key findings are: 1. Population Growth in Pakistan:
Pakistan’s population in 2023 reached 241.5 million, showing a significant
increase of 33.82 million from the 2017 census. Between 2017 and 2023, the
population of each of the provinces as a proportion of the national
population remained relatively stable, with slight increases in Sindh,
Balochistan, and ICT, and minor decreases in Punjab and Khyber Pakhtunkhwa. (Gallup Pakistan) 08 November, 2023 Pakistanis Reporting Afghan
Refugees Residing In Their Present Area Of Residence Has Decreased By A
Proportion Of 4% In The Past 8 Years In a Gallup & Gilani
Pakistan National Survey conducted in the year 2015, a representative sample
of adult men and women from across Pakistan was asked the following question,
“Please tell me, are there Afghan refugees residing in your areas (present
area of residence)?” In response to this question, 33% said yes, while 64%
said no. Comparative Picture: This question was asked again in 2023 to allow
a comparison to be made across the years. In 2023, 29% said yes and 69% no. (Gallup Pakistan) 08 November, 2023 AFRICA (Nigeria) Food Security Poll: 7 In 10
Adult Nigerians Often Go Hungry Due To Insufficient Food A new public opinion poll
conducted by NOIPolls has revealed that majority (70 percent) of adult
Nigerians nationwide often go hungry because there is not enough food.
However, 28 percent of Nigerians interviewed attributed the major cause of
the food insecurity crisis in Nigeria to Farmer-Herder clashes. Similarly, 16
percent linked the situation to unemployment. In addition, 12 percent of
Nigerians interviewed cited bad leadership among other factors that have
mostly impacted the food insecurity crisis in Nigeria. (NOI Polls) 09 November, 2023 (Mozambique) Mozambicans Call For Tighter
Governmental Regulations To Protect The Environment Findings show that a
majority of Mozambicans view pollution as a serious problem in their
communities. While many citizens consider it their personal responsibility to
limit pollution, a majority say the government should increase its efforts to
protect the environment. A majority (56%) of Mozambicans consider
pollution a “somewhat serious” or “very serious” problem in their
communities. o Citizens cite deforestation (23%), water pollution (20%), and
trash disposal (17%) the most important environmental problems in their
communities. o A majority (58%) see plastic bags as a major contributor to
pollution in Mozambique. (Afrobarometer) 06 November, 2023 WEST EUROPE (UK) One Year On, Has Rishi Sunak
Won Back Lost 2019 Tory Voters With the Conservatives
slumping to record low voting intention figures during Liz Truss’s short
tenure, when Rishi Sunak became prime minister the only way was up. The loyal
Tory vote collapsed even further after just three weeks of Liz Truss, to less
than 40%. This translated into an equal increase in the number of 2019 Tory
voters saying they’d vote for another party (rising to about 27%) and ‘don’t
know’ (again, about 27%). This drastic drop in support was enough to
contribute to her resigning as leader after just six weeks in power. (YouGov UK) 23 October, 2023 Britons Lack Confidence That AI
Can Be Developed And Regulated Responsibly With the UK hosting the AI
Safety Summit this week, the media is once again replete with warnings about
the threats the technology poses to the future of the human race. For all the
apocalyptic focus when AI appears on the front pages, only 18% of Britons say
their first thought when the topic of AI comes up is to do with the risks the
technology poses to humanity’s survival. Instead, the topic is far more
likely to conjure up thoughts about the impact on everyday life, like jobs
and society (50%) – indeed the Trades Union Congress today warned Rishi Sunak not to lose sight of the “here and
now” threats AI poses to people’s jobs. (YouGov UK) 01 November, 2023 Undecided Conservatives Still
Lean Towards The Party New YouGov data released
this week on Sky News tell us another part of the story – what this most
crucial set of voters think of Labour, the Conservatives, Keir Starmer, and
Rishi Sunak, what issues they are concerned about, and how likely they are to
vote for both parties. The headline figures for the Conservatives make for
troublesome reading; among their 2019 voter coalition, only four in ten (40%)
are still planning to vote Conservative. One in eight (12%) are currently
telling us they intend to vote for Reform UK, 11% say they will vote Labour,
7% would not vote, and 23% tell us they “don’t know” how they will vote. (YouGov UK) 03 November, 2023 Most Britons Have Sympathy For
Both Sides In Israel-Palestine Conflict YouGov has been tracking
attitudes towards the Israel-Palestine conflict since before the recent
outbreak of fighting. Our latest tracker results show that 19% of Britons say
they ‘most sympathise’ with the Israeli side, while an identical 19% say they
most sympathise with the Palestinian side. A further 31% sympathise with both
sides equally, while the remaining 31% are unsure. Among those with a more
pro-Israeli view, 49% say they sympathise at least somewhat with the
Palestinians. Likewise, 54% of those with a more pro-Palestinian stance say
they have at least some sympathy for the Israelis. (YouGov UK) 06 November, 2023 The Death Of
Business Attire? Just 7% Of Workers Wear A Suit To Work A quarter of workers (26%) say they wear “casual attire” at work,
while one in five wear a work uniform provided by their employer (19%).
Dedicated work uniforms are the most common among those in C2DE occupations
(i.e. working class jobs) at 34%. A further one in eleven workers (9%)
say they wear safety workwear or protective clothing. This is more common
among men (13%) and among C2DE workers (22%). (YouGov UK) 14 November, 2023 Parents Say Christmas
Expectations Have Got Out Of Control And Majority Are Concerned About
Affording Presents For Their Children This Year A new poll by Ipsos, finds
that three quarters (73%) of parents think that the expectations on how much
to spend on children’s Christmas presents has got out of control, with a
similar proportion (74%) saying that children should be happy with whatever
they get. Even so, more than half (54%) of parents feel pressured to get
their children the latest toys, gadgets and clothes at Christmas. (Ipsos MORI) 05 November, 2023 Eight In Ten Britons Say Public
Services Have Got Worse Over The Past 5 Years The latest Ipsos Political
Monitor, taken 1st – 8th November 2023, explores public attitudes towards
Britain’s public services, the economy and tax and spend policies ahead of
the upcoming Autumn Statement. We also update our latest voting intention
figures and leader satisfaction ratings. 78% currently think the quality of
public services has got worse over the past 5 years (including 70% of
Conservative supporters). This compares to 63% who said the same in March
2017 ahead of the General Election later that year, and 40% back in November
2012. (Ipsos MORI) 17 November, 2023 (France) What Do The French Think Of
Napoleon? On November 22, 2023, the
biopic “Napoleon”, by director Ridley Scott, will be released, with Joaquin
Phoenix in the role of the emperor. More
than one in four French people (26%) say they would like to
see the film. The upcoming release of the film raises the following
question: what do the French think of
Napoleon Bonaparte in 2023? 34% favorable opinion against 21%
unfavorable opinion. Note: 34% of French people are neutral on this
subject and 9% do not comment. (YouGov France) 25 October, 2023 44% Of Companies Struggle To
Recruit Generation Z Talent In a very tight job
market, these are ultimately essential criteria which define the
attractiveness of an employer from the point of view of assets to join a
company: competitive health insurance (91%), leave greater than the average
(89%), flexibility in hours or place of work (82%). Good news: HR
decision-makers are rather in tune with these criteria, which they also
consider among the most effective. On the podium of the actions most
commonly implemented by companies to invest in their employer brand, we find
firstly flexibility and the organization of working hours (52%), then
internal professional development which passes through training, coaching or
even mobility (51%), and a working environment conducive to relaxation (47%). (Ipsos France) 23 October, 2023 Only 1 In 4 French Companies
Know Exactly About Invoicing Reform From July 1 , 2024,
all companies, regardless of their size, must be able to receive their
invoices in electronic form. According to the results of this survey,
75% of the companies questioned say they do not know precisely the challenges
of the electronic invoicing reform which will come into force next
year. The low level of information among companies on the different
aspects of the reform is worrying: 32% say they feel poorly informed on all the
subjects inherent to this platform (registration procedures, data to be
transmitted, precise timetable for the reform, etc. ) and believe that they
will not be able to make the necessary transition by July 1, 2024. (Ipsos France) 08 November, 2023 (Italy) Annual Observatory On
Psychological Well-Being In Italian Companies 76% of Italian workers have experienced at least one symptom of
burnout. 1 in 5 people have been diagnosed. A significant
figure emerges from the results: 76% have
experienced at least one of the main symptoms of burnout - feeling
of exhaustion, decrease in work efficiency, increase in mental detachment,
cynicism about work - a percentage growing by +14% compared to last year . The most widespread symptom is the
feeling of exhaustion while for GenZ ,
specifically white collars, the most frequent symptom is the decline in work
efficiency (56%). (BVA Doxa) 08 November, 2023 NORTH AMERICA (USA) Poll Shows Biden Support
Slumping Among Michigan Muslims A new survey conducted by
one of Joe Biden’s former pollsters shows the president’s support has
cratered among Muslim and Arab Democrats in Michigan, a key
demographic group that
overwhelmingly backed Biden in the swing state in 2020. About two-thirds of Arab and Muslim Democrats said
they now think they will vote to replace Biden, and three-quarters said they
are willing to vote for a third-party candidate. The results appear driven by
the U.S.-backed Israeli campaign in Gaza, with those voters almost
unanimously giving Biden a “poor” rating for his handling of the
Israeli-Palestinian conflict, the most negative response option available. (NBC News) 06 November, 2023 Palestinians In Gaza At Risk
Before Israel-Hamas War Before the recent conflict
began, Palestinians living in Gaza were disproportionately struggling to
afford food. Twice as many people in Gaza (57%) than in the occupied West
Bank and east Jerusalem (28%) said they could not afford food at times in the
past 12 months. The same is true of shelter. The inability to afford shelter
matched its record high in Gaza before the conflict, with 29% struggling to
afford adequate shelter. While 17% who are struggling in the West Bank and
east Jerusalem is lower than in Gaza, it is still high compared with the
long-term trend. (Gallup) 02 November, 2023 Majority Now Say U.S. Losing Ground On Illegal
Drug Problem Americans are more
negative about U.S. progress in dealing with the problem of illegal drugs
than at any prior point in Gallup’s trend, which dates back to 1972. For the
first time, a majority of U.S. adults, 52%, say the U.S. has lost ground in
coping with the illegal drug problem, while a record-low 24% say it has made
progress. Another 23% believe it has stood still. The latest results, from
Gallup’s Oct. 2-23 Crime survey, mark a sharp reversal from the prior reading
in 2019. At that time, more Americans were optimistic that progress was being
made (41%) than believed the U.S. was losing ground (30%) in the effort. (Gallup) 10 November, 2023 81% Of U.S. Adults – Versus 46%
Of Teens – Favor Parental Consent For Minors To Use Social Media Most U.S. adults (81%) say
they support social media companies requiring parental consent for minors to
create a social media account. About seven-in-ten favor requiring people to
verify their age before using social media sites (71%) and setting limits on
how much time minors can spend on these platforms (69%). Only about
one-in-ten adults oppose each of these three measures. Still, some adults are
uncertain. For example, roughly one-in-five adults are unsure if companies
should require age verification (18%) or set time limits for minors (17%). (PEW) 31 October, 2023 About 1 In 5 U.S. Teens Who’ve
Heard Of Chatgpt Have Used It For Schoolwork Roughly one-in-five
teenagers who have heard of ChatGPT say they have used it to help them do
their schoolwork, according to a new Pew Research Center survey of U.S. teens
ages 13 to 17. With a majority of teens having heard of ChatGPT, that amounts
to 13% of all U.S. teens who have used the generative artificial intelligence
(AI) chatbot in their schoolwork. Overall, two-thirds of U.S. teens say they
have heard of ChatGPT, including 23% who have heard a lot about it. But awareness
varies by race and ethnicity, as well as by household income: (PEW) 16 November, 2023 (Canada) Majority — Including
Two-In-Five Past Liberal Voters — Say Trudeau Should Step Down A new study from the
non-profit Angus Reid Institute finds more than half of Canadians (57%)
holding the view that Trudeau should step down, while three-in-ten (28%) say
he should lead the Liberals into the next election. Importantly, 2021 Liberal
voters are divided, with close to equal numbers saying he should stay on
(44%) or leave the party to a fresh face (41%). The impetus to make a
change may be building, as the Liberals trail the opposition
Conservative Party by 11 points in vote intention. (Angus Reid Institute) 18 October, 2023 Mortgage Woes Grow: Number Of Canadians Saying
Their Mortgage Is ‘Very Difficult’ To Pay Has Doubled Since March Overall, Canadians are
more down than usual on their financial situation and prospects. Half (49%)
say they are in a worse financial position than they were last year, while 35
per cent expect to be in a worse position a year from now. Both figures tie records
seen in more than 13 years of tracking data from the Angus Reid Institute. More
than half (54%) say it is difficult to feed their household given the cost of
food currently. (Angus Reid Institute) 23 October, 2023 Israel-Gaza: Canadians Share Sympathies With
Both Sides In Warzone, Two-Thirds Call For Ceasefire New data from the Angus
Reid Institute finds Canadians own responses reflecting the same spectrum of
feelings and opinions that have been expressed internationally. Nuance and
division are evident across a varying number of issues surrounding this
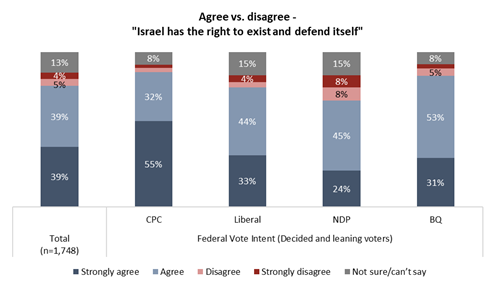
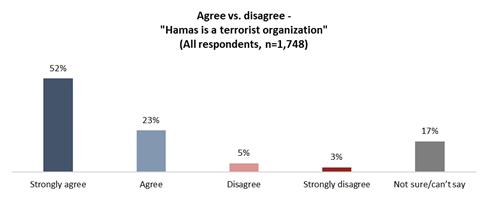
conflict. While 75 per cent say Gaza’s governing organization Hamas is a
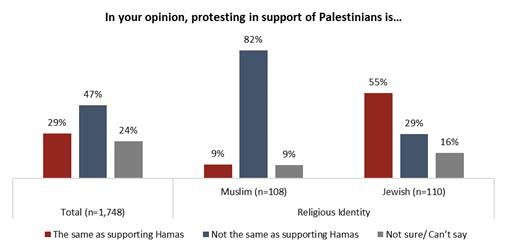
terrorist group, nearly half (47%) say that supporting the Palestinian cause
is not the same as supporting Hamas. Further, four-in-five (78%) say Israel
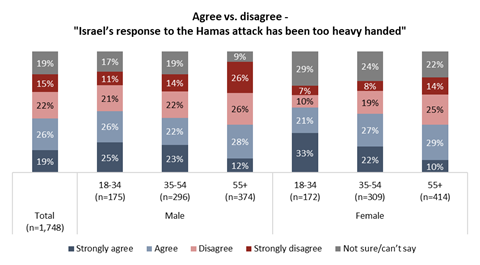
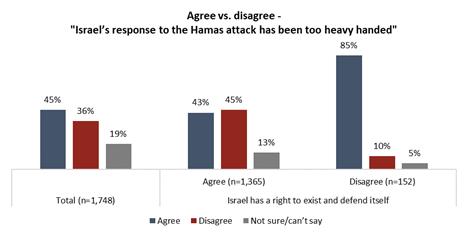
has the right to exist and to defend itself, but Canadians are also more
likely to say that the Israeli response has been too heavy handed (45%) than
not (36%). (Angus Reid Institute) 07 November, 2023 AUSTRALIA Over 1.57 Million Australians Are Now ‘At Risk’
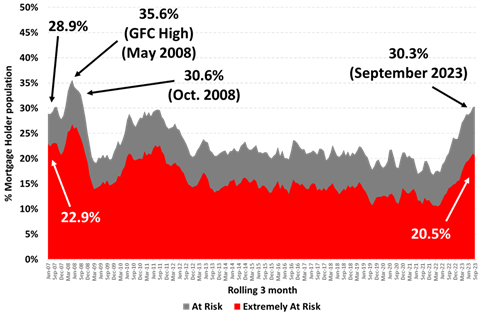
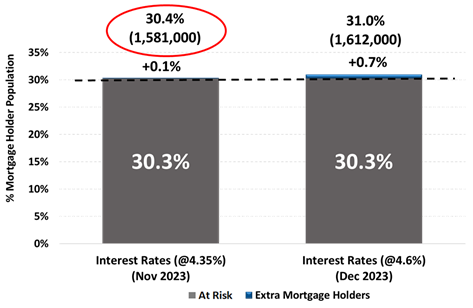
Of ‘Mortgage Stress’ Representing 30.3% Of Mortgage Holders The number of Australians
‘At Risk’ of mortgage stress has increased by 766,000 since May 2022 when the
RBA began a cycle of interest rate increases. Official interest rates are now
at 4.1% in October 2023, the highest official interest rates since May 2012,
over a decade ago. The number of mortgage holders considered ‘Extremely At
Risk’, is now numbered at 1,043,000 (20.5%) which is now significantly above
the long-term average over the last 15 years of 15.3%. (Roy Morgan) 31 October, 2023 Over 3 Million Australians Were Either
Unemployed (1.54 Million) Or Under-Employed (1.58 Million) In October –
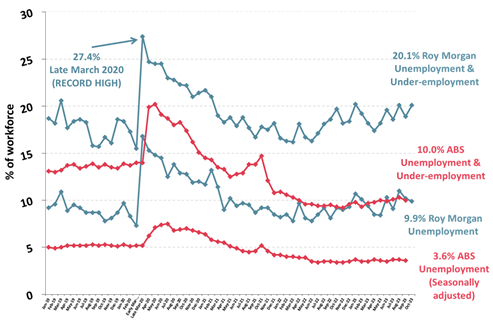
Highest For Three Years ‘Real’ unemployment was
down 0.3% to 9.9% - an estimated 1,542,000 Australians in October. There were
more people looking for part-time jobs (up 92,000 to 936,000) but many fewer
people looking for full-time jobs (down 114,000 to 606,000) compared to a month
ago. The October Roy Morgan
Unemployment estimates were obtained by surveying an Australia-wide cross
section of people aged 14+. A person is classified as unemployed if they are
looking for work, no matter when. The ‘real’ unemployment rate is presented
as a percentage of the workforce (employed & unemployed). (Roy Morgan) 08 November, 2023 Australians Are Evenly Divided On Whether Israel
Should Withdraw Their Armed Forces From Gaza Immediately Or Not Now 51% of Australians say the Israeli army should withdraw their armed
forces from Gaza immediately, while 49% say they should not, according to a
special Roy Morgan Snap SMS survey conducted with a cross-section of 1,650
Australians aged 18+ from Thursday November 9 – Monday November 12, 2023.
They were asked: “Turning to the
current conflict in the Middle East between Israel and Hamas in Gaza. In your
opinion should the Israeli army withdraw their armed forces from Gaza
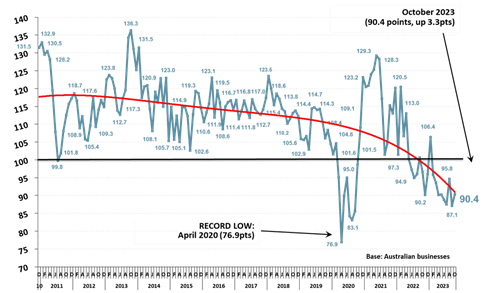
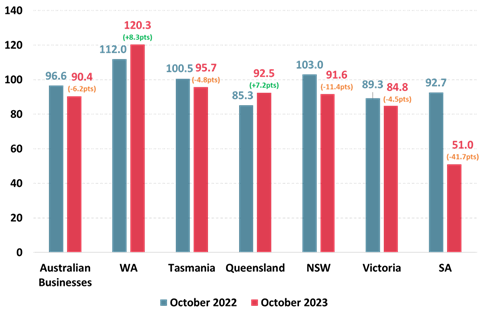
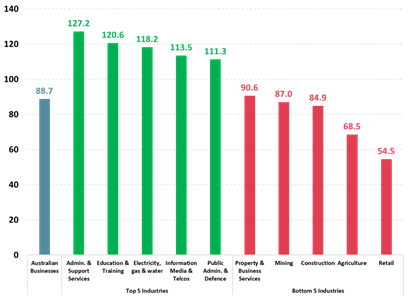
immediately or not?” (Roy Morgan) 13 November, 2023 Roy Morgan Business Confidence Up 3.3pts To 90.4
In October – Before The RBA Raised Interest Rates Again To 4.35% A majority of businesses
are worried about the performance of the Australian economy with 56.5%
expecting ‘bad times’ for the economy over the next year and even more,
58.2%, expecting ‘bad times’ for the economy over the next five years. Nevertheless,
businesses remain relatively positive about their own prospects over the next
year with 40.1% saying they will be ‘better off’ financially this time next
year compared to only 29.2% that say they will be ‘worse off’ – a positive
net rating of 10.9% points and the only index in positive territory. (Roy Morgan) 14 November, 2023 ANZ-Roy Morgan Consumer Confidence Plunges
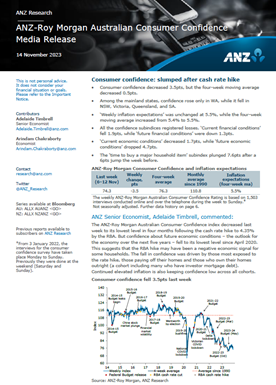
3.5pts To 74.3 – After The RBA Raises Interest Rates To 12-Year High Of 4.35% ANZ-Roy Morgan Consumer Confidence dropped 3.5pts to 74.3 this week
after the RBA raised interest rates by 0.25% to 4.3% - the highest official
interest rates have been in 12 years. Consumer Confidence is now at its lowest since mid-July 2023 and has
spent a record 41 straight weeks below the mark of 85. Consumer Confidence is
now 6.5pts below the same week a year ago, November 7-13, 2022 (80.8) and is
now clearly below the 2023 weekly average of 78.0. (Roy Morgan) 14 November, 2023 MULTICOUNTRY STUDIES October 2023: Consumer Confidence Declines
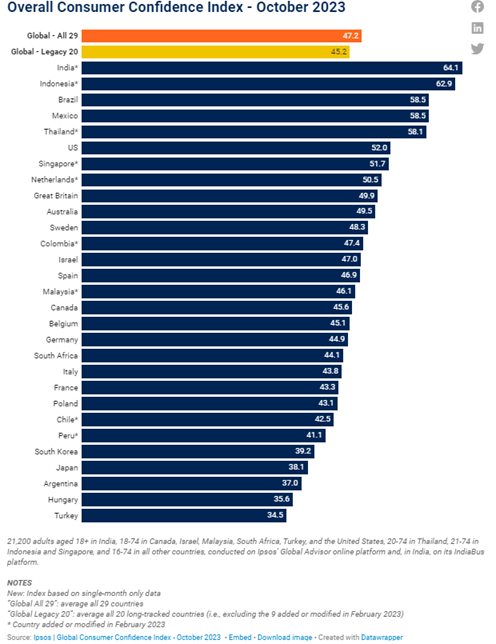
Sharply Across Southeast Asia, A 29 Country-Survey Ipsos’
Global Consumer Confidence Index is
down 0.4 point from last month to 47.2. This marks the fifth
consecutive month without a significant month-over-month change for the
index. Among 29 economies measured, just four show significant gains in
consumer sentiment while nine show a notable decline. The global Current and Investment indices both show
significant declines this month of more than half a point. In
contrast, the global Expectations and Jobs’ indices show little change. (Ipsos Global) 19 October, 2023 Source: https://www.ipsos.com/en/october-2023-consumer-confidence-declines-sharply-across-southeast-asia Survey Across 142 Countries Tells Almost A
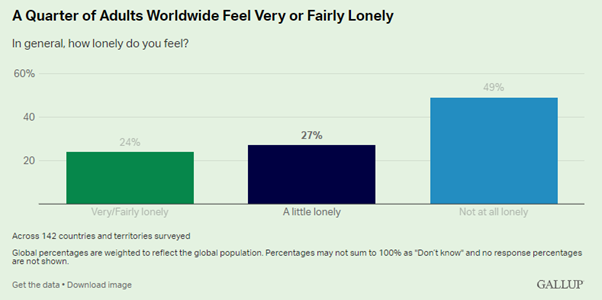
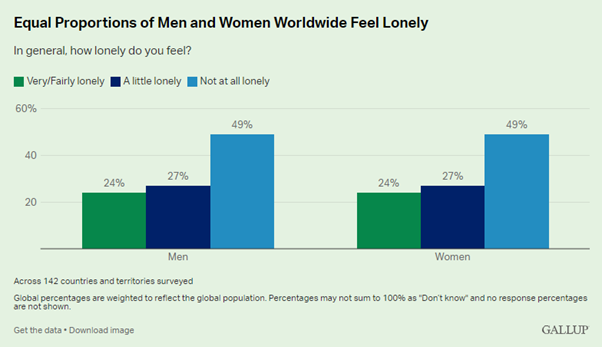
Quarter Of The World Feels Lonely Nearly one in four people
worldwide -- which translates into more than a billion people -- feel very or
fairly lonely, according to a recent Meta-Gallup survey of more than 140
countries. Notably, these numbers could be even higher. The survey represents
approximately 77% of the world’s adults because it was not asked in the
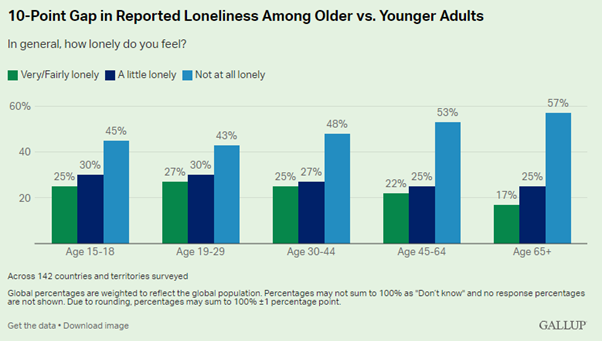
second-most populous country in the world, China. Global results indicate
that the lowest rates of feeling lonely are reported among older adults (aged
65 and older), with 17% feeling very or fairly lonely, while the highest
rates of feeling lonely are reported among young adults (aged 19 to 29), with
27% feeling very or fairly lonely. (Gallup) 24 October, 2023 Source: https://news.gallup.com/opinion/gallup/512618/almost-quarter-world-feels-lonely.aspx Most
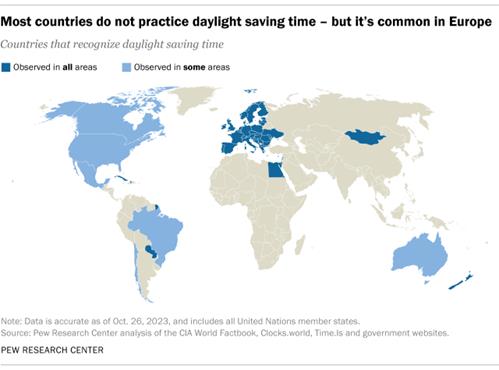
Countries Don’t Observe Daylight Saving Time, A Survey Across 193 Nations Only about a third of the world’s countries practice daylight saving
time, and the vast majority of them are in Europe. Within
Europe – as defined by the United Nations – only Armenia, Azerbaijan, Belarus,
Georgia, Iceland, Russia and Turkey do not practice daylight saving time.
Outside of Europe, daylight saving time is most common in North America –
where parts of the U.S. and Canada use it – as well as Latin America and the
Caribbean. Egypt stands out as the only African nation with daylight saving
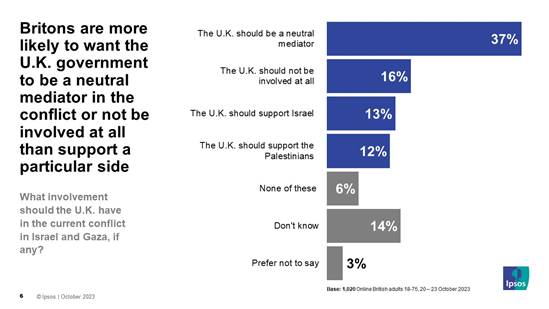
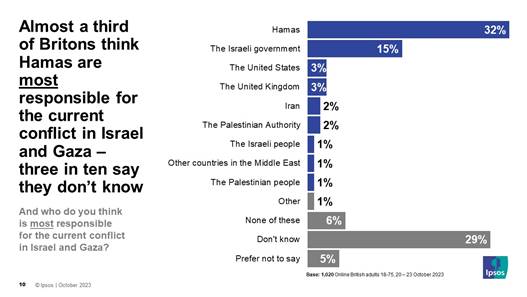
time. (PEW) 26 October, 2023 Source: https://www.pewresearch.org/short-reads/2023/10/26/most-countries-dont-observe-daylight-saving-time/ Israel / Gaza Conflict: 7 In 10 Britons
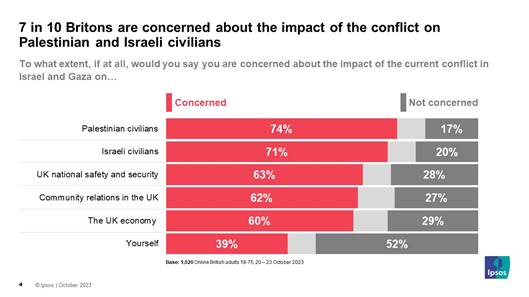
Concerned About Plight Of Civilians On Both Sides, A Study In US And UK New polling from Ipsos,
conducted October 20-23rd, explores public attitudes to the current conflict
in Israel and Gaza amongst British adults. 69% of Britons say they are
following the current conflict in Israel and Gaza very or fairly closely.
This is more than the 62% that say the same about the Russian invasion of
Ukraine but less than the 81% that claim to be following stories related to
the rising cost of living. 58% claim to know a great deal or fair amount
about the current conflict in Israel and Gaza and 53% claim to know a great
deal or fair amount about the historic reasons for the conflict involving
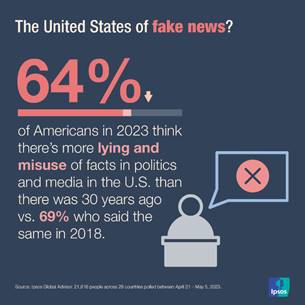
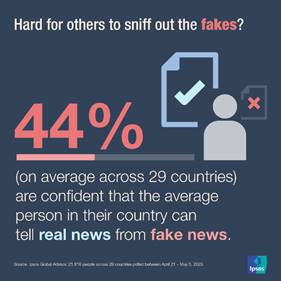
Israelis and the Palestinians. (PEW) 27 October, 2023 People Across 29 Countries Are Worrying That
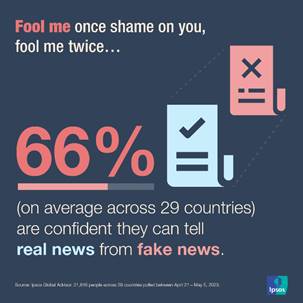
Artificial Intelligence Is Making It Easier To Trick People (Ipsos Global) 31 October, 2023 Source: https://www.ipsos.com/en/data-dive-fake-news-age-ai Comparing Views Of The U.S. And China In 24
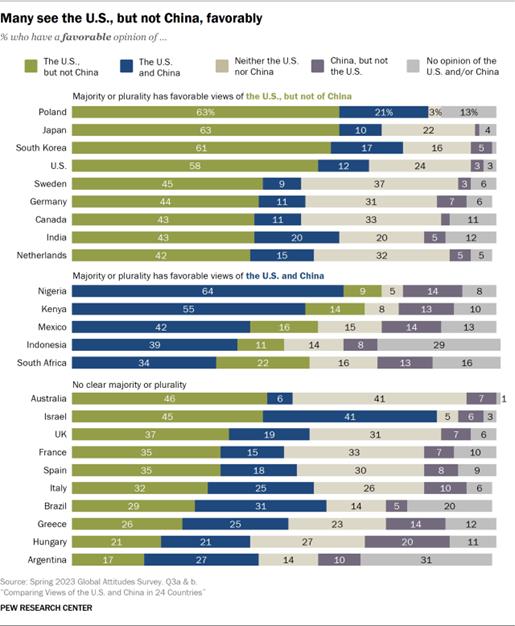
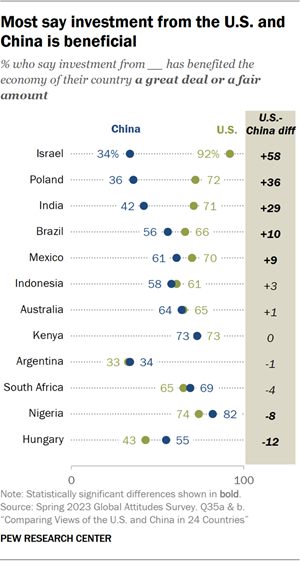
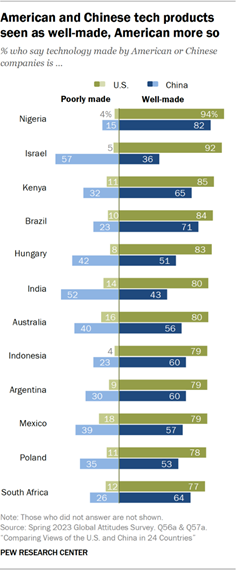
Countries In Greece, 93% say the
U.S. interferes in the affairs of other countries, compared with 56% who say
the same for China, for a difference of 37 percentage points. The Greek flag
is therefore plotted farther to the left, closer to the U.S. end of the
scale, at 37. Australians, though, see little difference between the
superpowers and consider both the U.S. (79%) and China (77%) to be
interventionist powers. The Australian flag is therefore plotted at 2, close
to the midpoint, which represents no difference in ratings of the two
countries on this measure. (PEW) 06 November, 2023 Source: https://www.pewresearch.org/global/2023/11/06/comparing-views-of-the-us-and-china-in-24-countries/ ASIA
817-821-43-01/Polls Japanese Unimpressed With
Stimulus Steps, Kishida's Ratings Hit Low—Poll
Nearly two-thirds of
Japanese are not impressed with the government’s new economic stimulus
measures as support for Prime Minister Fumio Kishida slipped to its lowest
yet, a Kyodo news poll found on Sunday. The telephone survey found
62.5% of respondents did not highly rate the 17 trillion yen ($110 billion)
package, announced Thursday, of tax cuts and other measures. Support for Kishida’s
cabinet fell 4.0 percentage points from three weeks earlier to 28.3%, its
lowest in the Kyodo survey since he took office in October 2021, and in line
with other recent surveys. His disapproval rating rose 4.2 points to 56.7% in
the survey conducted from Friday to Sunday. It was the first time in
the Kyodo poll that approval for a Liberal Democratic Party-led government
has fallen below 30% since 2009. Kishida’s measures, aimed
at cushioning the economic blow from rising inflation, including cutting
annual income and other taxes by 40,000 yen ($270) per person and paying
70,000 yen to low-income households. (Asahi Shimbun) 06 November, 2023 Source: https://www.asahi.com/ajw/articles/15049471
817-821-43-02/Polls 58% Of Pakistanis Feel
That Unemployment In Pakistan Will Worsen In The Next 6 Months
According to a survey
conducted by Gallup & Gilani Pakistan and Dun & Bradstreet Pakistan,
58% of Pakistanis feel that unemployment in Pakistan will worsen in the next
6 months. Only 18% optimistic that unemployment will get better. A nationally
representative sample of adult men and women from across the country was
asked the question, “In your opinion, in next 6 months, unemployment in
Pakistan will be…?” In response, 3% said ‘much better’, 15% said ‘better’,
16% said ‘same as before’, 31% said ‘worse’, 27% said ‘much worse’, and 8%
said that they did not know or gave no response.
(Gallup Pakistan) 08 November, 2023 Source: https://gallup.com.pk/wp/wp-content/uploads/2023/11/8.11.23-English-Combined.pdf
817-821-43-03/Polls Population Of Pakistan
Reaches 241.5 Million, With An Average Yearly Increase Of 2.55% Since 2017
Gallup Pakistan recently
conducted an analysis of the results of the 7th Population & Housing
Census 2023. Some key findings are: 1. Population Growth in Pakistan:
Pakistan’s population in 2023 reached 241.5 million, showing a significant
increase of 33.82 million from the 2017 census. 2. Regional Population
Changes: Punjab recorded the highest population increase with 17.7 million,
followed by Sindh with 7.8 million, Khyber Pakhtunkhwa with 5.36 million,
Balochistan with 2.55 million, and Islamabad Capital Territory (ICT) with
0.36 million. 3. Population Growth Rates: Balochistan had the highest average
population growth rate at 3.2% annually, followed by ICT (2.8%) and Sindh
(2.57%). The lowest growth rates were in Khyber Pakhtunkhwa (2.38%) and
Punjab (2.53%), both below the national average of 2.55% per annum between
2017-2023. 4. Provincial Proportions: Between 2017 and 2023, the population
of each of the provinces as a proportion of the national population remained
relatively stable, with slight increases in Sindh, Balochistan, and ICT, and
minor decreases in Punjab and Khyber Pakhtunkhwa. 5. Regional Growth
Variations: Population growth rates varied across regions. The highest annual
growth was in Balochistan's Kalat and Makran Region (4.45%), while the lowest
was in Sindh's Interior Sindh region (1.76%). 6. District-level Changes:
Amongst districts, Lahore district in Punjab had the highest population
increase with 1.88 million, while Musakhel district in Balochistan had the
lowest with 0.02 million. Furthermore, the Lower Kohistan district in KPK had
the highest average annual population growth rate at 9.01%, while Tando
Muhammad Khan district in Sindh had the lowest at 1.18%. This summary
provides an overview of Pakistan's population growth and its regional and
district-level variations between 2017 and 2023. (Gallup Pakistan) 08 November, 2023 Source: https://gallup.com.pk/wp/wp-content/uploads/2023/11/Census-2023-PR-3.pdf
817-821-43-04/Polls Pakistanis Reporting
Afghan Refugees Residing In Their Present Area Of Residence Has Decreased By
A Proportion Of 4% In The Past 8 Years
In a Gallup & Gilani
Pakistan National Survey conducted in the year 2015, a representative sample
of adult men and women from across Pakistan was asked the following question,
“Please tell me, are there Afghan refugees residing in your areas (present
area of residence)?” In response to this question, 33% said yes, while 64%
said no. Comparative Picture: This question was asked again in 2023 to allow
a comparison to be made across the years. In 2023, 29% said yes and 69% no.
Trend Analysis: The proportion of people who said yes decreased by 4%, while
those that said no increased by 5% during the same period.
(Gallup Pakistan) 08 November, 2023 Source: https://gallup.com.pk/wp/wp-content/uploads/2023/11/10.11.23.History-poll.pdf AFRICA
817-821-43-05/Polls Food Security Poll: 7 In
10 Adult Nigerians Often Go Hungry Due To Insufficient Food
Food Security in Nigeria Abuja,
Nigeria. November 7th, 2023 – A new public opinion
poll conducted by NOIPolls has revealed that majority (70 percent) of adult
Nigerians nationwide often go hungry because there is not enough food.
However, 28 percent of Nigerians interviewed attributed the major cause of
the food insecurity crisis in Nigeria to Farmer-Herder clashes. Similarly, 16
percent linked the situation to unemployment. This corroborates with the
publication of Relief Web, a humanitarian information service provided by the
United Nations Office for the Coordination of Humanitarian Affairs (OCHA),
that the food security situation in Nigeria has over the years been impacted
especially by violent conflicts, including the insurgency in the North-East;
armed banditry in the Northwest; perennial farmer – herder conflicts in the
North-central[1]. According to the publication, other
factors contributing to food insecurity include rising unemployment,
engendering, and compounding cost-of-living crisis, with deleterious effects
on the conditions of living of citizens, and their ability to access food[2]. In addition, 12 percent of Nigerians
interviewed cited bad leadership among other factors that have mostly
impacted the food insecurity crisis in Nigeria.
More findings revealed
that most Nigerians (89 percent) affirmed they worry about whether the food
they will buy will be enough. In the same vein, 88 percent of Nigerians
interviewed stated that they worry about whether the food they buy will run
out before they get money to buy more. Furthermore, 81 percent affirmed they
cut the size of their meal because they or their family member did not have
enough food. Still in the affirmative, 80 percent revealed that they eat the
same food several days in a row because they have just a few different kinds
of food on hand and do not have money to buy more. Sadly, 49 percent of
Nigerians interviewed also stated they had gone to bed hungry at some point
because they could not afford to buy food while 40 percent stated that they
did not eat because their family did not have enough money for food.
With regards to
recommendations on how the Federal Government can improve food security in
Nigeria, 26 percent advocated that the Federal Government should tackle
insecurity. Other suggestions include Improving agricultural Policy (14
percent), opening all closed borders (12 percent), Reducing fuel prices (9
percent), Creating job opportunities (7 percent), and Address Climate Change
(7 percent) amongst others. These are some of the key findings from the food security Poll
conducted in the week commencing 23rd
October 2023.
Background Food security, as defined
by the United Nations Committee on World Food Security, means that all
people, at all times, have physical, social, and economic access to
sufficient, safe, and nutritious food that meets their preferences and
dietary needs for an active and healthy life. It is also the state of having
reliable access to a sufficient quantity of affordable, nutritious food[3]. The key drivers to the food insecurity
crisis in Nigeria have been linked to consistent violent crises, climate
change, inflation, and rising food prices. A January 2023 Press Release by
UNICEF reiterates that food access has been affected by persistent violence
in the north-east states of Borno, Adamawa and Yobe (BAY), and armed banditry
and kidnapping in states such as Katsina, Sokoto, Kaduna, Benue, and Niger[4]. The reports also show that
children are the most vulnerable to food insecurity with approximately 6
million of the 17 million food-insecure Nigerians today being children under
5 living in Borno, Adamawa, Yobe, Sokoto, Katsina, and Zamfara states. These North-Eastern
States are hotspots for insecurity and malnutrition.
According to the November
2022 World Food Programme Nigeria, WFP report, poor feeding practices and
worsening food insecurity have continued to loom heavily. Ranking 163rd on
the Human Development Index (HDI) for the second year in a row, Nigeria has
also experienced the worst flooding in a decade, further eroding chances for
improved food security among the most vulnerable[5].
Flooding occasioned by the
prevalence of climate change in the country has largely impacted the
availability and affordability of food resulting in the undesirable challenge
of food insecurity. A report of the National Emergencies Management Agency
[NEMA] shows, that the 2022 floods led to the destruction and washing away of
over 675,000 hectares of farmland. One can only imagine the extent of the
impact of this scale of destruction of farmlands on agricultural activities
and food production across the country. Farmers, the majority of whom are
small-scale farmers, lost not only crops and harvests, but also farm animals,
poultry, fishery, and farm implements to the raging floods[6].
Regrettably, in 2022,
countries that are highly dependent on food imports have seen a spike in food
inflation, as the war in Ukraine and associated supply shortages caused sharp
price hikes for wheat and other staples on top of high fuel and transportation
costs resulting in a deterioration in food security. The prices of staple
food in sub-Saharan Africa (SSA) have surged by an average of 23.9 percent in
2020-22 (Okou, Spray, and Unsal, 2022)[7].
It is against these
backgrounds that have impacted negatively on the health, nutrition, and
socio-economic lives of Nigerians that NOIPolls surveyed to feel the pulse of
Nigerians regarding food security.
Survey
Findings The first question sought
to gauge the opinion of respondents on what food insecurity is. The survey
result revealed that a greater percentage (51 percent) of adult Nigerians
nationwide affirmed that they know what food insecurity. On the other hand,
49 percent of the respondents stated otherwise.
Knowledge of Food Security When asked if they think
there is food insecurity in Nigeria. Findings show that the vast majority (90
percent) of the respondents answered in the affirmative with the North-East
and North-West both (93 percent) having the highest proportion of respondents
who made the assertion. However, 8 percent stated otherwise.
Nigerians thought on Food
Insecurity Furthermore, a couple of
statements that bother on food availability and feeding patterns were read to
respondents in which they were asked to reply either ‘’yes’’ or ‘’no’’.
Analysis shows that most of the respondents (89 percent) affirmed that they
worry about whether the food they can afford to buy will be enough.
Similarly, 88 percent worry about whether the food will run out before
getting money to buy more. 81 percent of adult Nigerians interviewed reveal
that they cut down the size of meals because they or their family did not
have enough money for food. Further findings show that 80 percent of
respondents affirmed they eat the same food for several days in a row because
they lack money to buy varieties of food. Moreso, 70 percent lamented that
they go hungry due to a lack of food. Additionally, 49 percent disclosed that
they went to bed hungry because there was not enough money to buy food. When
asked if they didn’t eat a whole day because their family did not have enough
money for food, 40 percent also answered in the affirmative.
Food Security Scenarios Subsequently, when asked
which factor has mostly impacted the food insecurity crisis in Nigeria, 28
percent pointed out insecurity (banditry/farmer-herders clashes), followed by
unemployment (16 percent) and bad leadership (12 percent). Other factors mentioned
are increment in fuel price/fuel subsidy (9 percent), increased
transportation fare (8 percent), and amongst others.
Factors impacting Food
Security Additionally, adult
Nigerians were asked to give recommendations on how food insecurity should be
tackled, and findings show that 26 percent suggested that the government
should tackle security, 14 percent advised that the government should improve
agricultural policy, open all closed borders (12 percent), reduce fuel price
(9 percent). Other suggestions include creating jobs (7 percent), addressing
climate change (7 percent), mechanized farming (5 percent), price
control/regulation (5 percent), other recommendations include encouraging
people to go into farming (4 percent), subsidize agricultural input (3
percent), and encourage good governance (2 percent).
Improving Food Security Conclusion In conclusion, findings
have shown that 51 percent of Nigerians interviewed know what food security
is. Similarly, 90 percent affirmed that there is food insecurity in Nigeria
with 28 percent citing herder-farmers clashes/insurgency as the top-most
factor that has impacted food security in the country, followed by
unemployment (16 percent) and bad leadership (14 percent) among others. To end the food security
crisis in Nigeria, survey findings show that tackling insecurity (26
percent), improving agricultural policy (14 percent), and opening all closed
borders (12 percent), were the top-mentioned recommendations for how food
security could be improved in the country. (NOI Polls) 09 November, 2023
817-821-43-06/Polls Mozambicans Call For
Tighter Governmental Regulations To Protect The Environment
Delayed by the country’s
long civil war, resource extraction in Mozambique gained traction after the
1992 peace accords and has experienced notable growth in the past
decade. Mozambique is expected to emerge as the third-largest global
exporter of natural gas (United Nations Environment Programme, 2019). Coal,
iron ore, tantalite, gold, bauxite, and graphite also form part of the wealth
of natural resources that have propelled the mining sector’s share of gross
domestic product from 1.2% in 2010 to almost 10% in 2020 (Kamer, 2023;
Britannica, 2023; World Bank, 2023). The number of people employed in the
mining sector increased from about 49,000 in 2010 to nearly 71,000 in 2019
(Kamer, 2022). While critical to
Mozambique’s economic development, the mining sector also joins agriculture,
industry, population growth, and urbanisation in contributing to growing
environmental problems such as air and water pollution, deforestation, and
the management of solid and human waste (United Nations Environment
Programme, 2023; Mutatisse et al., 2022; Global Water Partnership,
2022). In its national planning
and strategies, including the National Development Strategy and the Green
Economy Action Plan, the government has prioritised “green growth” through
sustainable infrastructure, efficient and sustainable use of resources, and
strengthened resilience and adaptability (African Development Bank, 2015;
Republic of Mozambique, 2014). Specific challenges are targeted through
programmes such as the Innovative, Clean, Resilient, and Participatory Cities
in Mozambique project (Wehubit Knowledge Exchange Network, 2023) and the
Programme for Sustainable Waste Management (Government of Mozambique,
2021). This dispatch reports on a
special survey module included in the Afrobarometer Round 9 questionnaire
that explores citizens’ experiences and perceptions of pollution,
environmental governance, and natural resource extraction. Findings show that a
majority of Mozambicans view pollution as a serious problem in their
communities. While many citizens consider it their personal responsibility to
limit pollution, a majority say the government should increase its efforts to
protect the environment. Mozambicans hold mixed
perceptions of the benefits and costs of natural resource extraction and say
the government should regulate the industry more tightly to reduce its
negative environmental impacts. Key findings
(Afrobarometer) 06 November, 2023 WEST
EUROPE
817-821-43-07/Polls One Year On, Has Rishi
Sunak Won Back Lost 2019 Tory Voters
The Conservative PM faces the problem of losing
voters to either side of his party With the Conservatives
slumping to record low voting intention figures during Liz Truss’s short
tenure, when Rishi Sunak became prime minister the only way was up. One year on, however, and
the Conservatives are still around 20 points behind Labour, and suffered some
of its worst ever by-election defeats last week. The key to success for
Sunak will be to win back voters who supported his party in 2019 but have
since moved away. While it still may be over a year before the country goes
to the ballot box, evidence from his first year in power, shows he has done
little to change this so far. Where
things were left To understand the full
picture of Sunak’s performance with 2019 Conservative voters, we have to go
back one further prime minister - to the end of Boris Johnson’s tenure.
Despite a commanding victory in the last election and strong ratings at the
start of the pandemic, continuous scandals in the latter half of Johnson’s
tenure meant by the time he stepped down he was only holding on to 50%-55% of
2019 Conservative voters. During his final months, most of these lost voters
were fairly evenly split between those who were saying they would vote for
other parties (about 20%) and those saying they were now unsure how they’d
vote (also about 20%). The loyal Tory vote
collapsed even further after just three weeks of Liz Truss, to less than 40%.
This translated into an equal increase in the number of 2019 Tory voters
saying they’d vote for another party (rising to about 27%) and ‘don’t know’
(again, about 27%). This drastic drop in support was enough to contribute to
her resigning as leader after just six weeks in power. Sunak
takes over Sunak’s first task as
leader was to steady the ship and win back some of these ‘lost’ voters. Previous YouGov research shows that the easiest of these two groups
to win back would be those who had moved away from the Conservatives in the
polls but were yet to commit to another party. Indeed, Rishi Sunak was
quickly able to win back some of those voters, with our first few polls after
he became leader showing the proportion saying ‘don’t know’ dropping a few
points to around 23%. This was, however, more likely a reflection of him simply
not being Liz Truss than approval of his own leadership credentials. While Sunak has managed to
keep the number of 2019 Tory voters saying ‘don’t know’ below 25% throughout
his year in charge, this proportion is still only around where it was at the
very end of Johnson’s time as leader, and worse than most of his last turbulent
year in office.
Sunak has had a harder
time winning back those who switched to another party, making virtually no
progress across the year compared to where things were under Truss – the
figure has remained around 27% of all 2019 Conservative voters. This is also
much higher than the number Johnson was losing to other parties in his last
month in power, which was around 20%. While the aggregate number
of those moving to other parties under Sunak appear to be about the same as
under Truss, the direction in which these voters are moving differs. Under
Truss around one in five (around 20%) were switching to a party to the left of
the Conservatives such as Labour, the Liberal Democrats or Greens while far
fewer voters were switching to Reform UK on the right of the party (about
5%). In his first couple of
months, Rishi Sunak did manage to win back some voters who were saying they’d
vote for a more left wing party, dropping this figure to around 15%.
Simultaneously though, he lost voters to the right with around 10% saying
they’d vote Reform UK. While you don’t want to be losing voters to any party,
with Labour and the Lib Dems likely to be the main challenger in most Tory
constituencies these voters are twice as valuable in straight head to heads.
Will
these voters return? While the last year may
not have been as successful as he would have wanted, Sunak will still be
hopeful that he can win back some of these lost voters as he gears up for the
general election. Those who say they are currently unsure how they’ll vote
may not be satisfied with the Conservatives, but they are also not willing to
support a different party at this stage, and so are easier to win back than
those lost to other parties. We’ve seen in the past that these voters may return once an
election is called. Of course, that doesn’t mean they can be taken for
granted, they could also move to another party, or not turn out to vote. Even if he successfully
convinces large numbers of unsure 2019 Conservatives to return at the next
election, this wouldn’t be enough to beat Labour. Those who are intending to
vote for another party will need far more convincing. The unique problem Sunak
has is that he is trying to win back lost voters on both sides, with similar
numbers moving to the left and the right of his party. Setting policies that
will appeal to these voters who are ideologically different is incredibly difficult,
while aiming for just one side risks losing further voters to the other. The last decade of British
politics has been far too turbulent to make any assumptions ahead of the next
election, but on the evidence of his first year in power, Rishi Sunak is
going to have to do something pretty spectacular to win back enough of the
lost voters he needs to win. (YouGov UK) 23 October, 2023
817-821-43-08/Polls Britons Lack Confidence
That AI Can Be Developed And Regulated Responsibly
Public attitudes on artificial intelligence tend to
be neutral to pessimistic With the UK hosting the AI
Safety Summit this week, the media is once again replete with warnings about
the threats the technology poses to the future of the human race. For all the apocalyptic
focus when AI appears on the front pages, only 18% of Britons say their first
thought when the topic of AI comes up is to do with the risks the technology
poses to humanity’s survival. Instead, the topic is far more likely to conjure
up thoughts about the impact on everyday life, like jobs and society (50%) –
indeed the Trades Union Congress today warned Rishi Sunak not to lose sight of the “here and
now” threats AI poses to people’s jobs.
These figures are
essentially the same as they were when we previously asked in May (indeed,
attitudes across all questions in this survey have remained constant over the
last six months). That’s not to say that
Britons spend a lot of time thinking versing themselves in the issues around
AI, however. Just 7% say they think they have a “great deal” of understanding
about what artificial intelligence is, and 6% think they have a great deal of
understanding of the issues surrounding the topic. Around four in ten
(37-40%) think they have a fair grasp on these things, but around half
(49-54%) say they have little to none.
Older Britons are far less
likely to feel a great or fair amount of engagement on the topic (34-36% of
the over-65s) than their younger counterparts (55-63% of 18-24 year olds). Few
Britons are optimistic about artificial intelligence Overall, expectations for
AI tend from neutral (35%) to pessimistic (35%). Only 16% of Britons are
optimistic about the impact artificial intelligence will have.
This lack of optimism may
be spurred by Britons’ very low expectations of tech companies and
regulators. Just 18% think that the technology companies that are developing
AI will do so responsibly. Likewise, despite calls by
prominent tech figures like Elon Musk and OpenAI boss Sam Altman for
governments to create regulatory bodies for AI development, just 14% of
Britons have confidence in the ability of current and future UK governments
to effectively regulate the development and use of AI.
These low expectations are
cross-party; only 17% of Tory voters and 13% of Labour voters alike have
confidence that British governments will be able to handle AI. Those who are most
optimistic about the impact AI will have are divided on tech companies, with
50% confident they will be responsible compared to 45% who lack this
confidence. Most (58%) still lack confidence in governments’ regulatory
abilities, however. Those who are neither optimistic nor pessimistic, or
outright pessimistic, overwhelmingly have low confidence in both tech firms
and regulators. (YouGov UK) 01 November, 2023
817-821-43-09/Polls Undecided Conservatives
Still Lean Towards The Party
While the Conservatives are holding on to just 40%
of those who backed them in 2019, there is little sign that their undecided
2019 voters are ready to jump ship to Labour Last week, YouGov data released on ITV Peston showed how the
near quarter of 2019 Conservative voters who are currently telling us they
“don’t know” who they would vote for if a general election were held tomorrow
have a distinct socio-demographic profile: they tend to be female, around
retirement age, homeowners (without mortgages), and are more prominent in the
South of England. Now, new YouGov data
released this week on Sky News tell us another part of the story – what this
most crucial set of voters think of Labour, the Conservatives, Keir Starmer,
and Rishi Sunak, what issues they are concerned about, and how likely they
are to vote for both parties. The headline figures for
the Conservatives make for troublesome reading; among their 2019 voter
coalition, only four in ten (40%) are still planning to vote Conservative.
One in eight (12%) are currently telling us they intend to vote for Reform
UK, 11% say they will vote Labour, 7% would not vote, and 23% tell us they
“don’t know” how they will vote. If Labour were indeed to
win over these one in nine Conservative voters, that would eclipse the
proportion of Labour voters who Johnson managed to flip (around 8%), but
would be fewer than the proportion of 1992 Conservative voters who Blair
moved into Labour’s column in 1997 (around 16%). Labour under Starmer need
something like a Blair-level performance at the next election to simply get
back into government, let alone build a sizeable majority. The fact that the
uncertain group is twice the size of the group who have switched directly to
Labour provides some light for the Conservatives as they seek to eat into a
substantial Labour polling lead. If they were to be brought back into the
fold, Labour’s polling lead would quickly evaporate. But how likely is
that? YouGov research from previous elections suggest “don’t know” voters generally
return to their previous party. But are circumstances different this time
around? We asked 5,621 adults in
England and Wales how likely or unlikely they were to vote for Labour, the
Liberal Democrats, and the Conservatives at the next general election, on a
scale of 0 (definitely not) to 10 (definitely will). Among uncertain 2019
Conservative voters, just 11% told us that they were actually actively
considering voting for Labour (scoring their propensity to vote for them at a
6 or higher). Conversely, 28% said they were actively considering voting
Conservative. One in eleven (9%) said the same of the Liberal Democrats.
Furthermore, uncertain
2019 Conservative voters have a far dimmer view of Starmer and Labour than
they do Sunak or the Conservatives. We asked the public on a scale of 0 to
10, where 0 is "strongly dislike" and 10 is "strongly
like", how much they liked or disliked each person or party. While Sunak
posted a net positivity score (the % of those scoring him 6 or above minus
the % scoring him 4 or below) of +7 among Tory 2019 voters who currently
don’t know how they would vote, Starmer scored a distant -55. Similarly,
among this key group, the Conservative party itself scored a net +7 while
Labour scored -61.
Lastly, the “don’t know”
tribe are much more likely to align with the sorts of issues that the
Conservatives want to talk about. For instance, they prioritise immigration
(56%) as one of their three ‘most important issues facing the country today’
to a much greater degree than those voters who have already made the jump to
Labour (42%), and are much less concerned about about housing – one of
Labour’s key policy areas – by 17% to 28%. On the economy, both groups
prioritise this but switchers (67%) to a greater degree than those who remain
uncertain (55%).
Taken altogether, this
suggests that while the Conservatives are currently struggling immensely to
hold their election-winning 2019 voter coalition together, Labour’s task in
winning over those former Conservative voters who are currently undecided looks to be a significant
one. (YouGov UK) 03 November, 2023 Source: https://yougov.co.uk/politics/articles/47774-undecided-conservatives-still-lean-towards-the-party
817-821-43-10/Polls Most Britons Have Sympathy
For Both Sides In Israel-Palestine Conflict
Those who tend to take a side are split in whether
or not they have sympathy for the other side, however YouGov has been tracking
attitudes towards the Israel-Palestine conflict since before the recent
outbreak of fighting. Our latest tracker results
show that 19% of Britons say they ‘most sympathise’ with the Israeli side,
while an identical 19% say they most sympathise with the Palestinian side. A
further 31% sympathise with both sides equally, while the remaining 31% are
unsure.
A new survey looks into
these attitudes in more depth, asking Britons to subsequently say how much
sympathy they have for either side in the conflict. The four in ten Britons
who express a tendency to support one side more than the other are split on
whether they also hold some sympathy for the other side. Among those with a
more pro-Israeli view, 49% say they sympathise at least somewhat with the
Palestinians. Likewise, 54% of those with a more pro-Palestinian stance say
they have at least some sympathy for the Israelis. However, 44-46% of those
who sympathise with one side more than the other say they “don’t sympathise
at all” with the other side.
Looking at the British
public as a whole, 56% express at least some sympathy for both sides,
including 15% who say they sympathise a great deal with those on either side
of the conflict. Only 3% have no sympathy for either – 8% sympathise solely
with the Israelis and an additional 9% sympathise only with the Palestinians.
(YouGov UK) 06 November, 2023
817-821-43-11/Polls The Death Of Business
Attire? Just 7% Of Workers Wear A Suit To Work
“Smart casual” is the dress code for the largest
number of workers Wearing a suit to the
office was once a default expectation, for men at least, but new YouGov data
shows that just a small minority of workers continue to do so. Just 7% of
workers say they don “business attire” at work, including 8% of male workers. Even in ABC1 occupations
(i.e. middle class jobs) just 10% say they wear a suit, and among those in
‘A’ occupations (those in higher managerial positions or professional
occupations) this still only hits 13%. The most common work dress
is “smart casual attire”, which 34% of workers say describes what they wear
to work. This is particularly common for female workers (43%) and those in
middle class jobs (44%).
What
counts as smart casual attire, you ask? A recent YouGov survey showed how
Britons define it. A quarter of workers (26%)
say they wear “casual attire” at work, while one in five wear a work uniform
provided by their employer (19%). Dedicated work uniforms are the most common
among those in C2DE occupations (i.e. working class jobs) at 34%. A further one in eleven
workers (9%) say they wear safety workwear or protective clothing. This is
more common among men (13%) and among C2DE workers (22%). Unsurprisingly, those who
work from home the whole time are more likely to dress casually than their
counterparts who have to leave the house. Nevertheless, the suit remains
firmly a thing of the past even for those who attend the workplace. Only 7% of those workers
who never work from home wear a suit to work, as do 11% who work from home
some of the time. (Our question asked people who worked from home some of the
time to answer based on what they wore to the workplace, rather than what they
wore at home).
Those who never work from
home split equally between wearing smart casual (30%) or a work uniform
(31%). Most common among those who work from home some of the time is smart
casual (49% - remember this applies to what they wear when they visit the
office), while most of those who work from home the whole time wear casual
attire (54%). (YouGov UK) 14 November, 2023
817-821-43-12/Polls Parents Say Christmas
Expectations Have Got Out Of Control And Majority Are Concerned About
Affording Presents For Their Children This Year
A new poll by Ipsos, finds
that three quarters (73%) of parents think that the expectations on how much
to spend on children’s Christmas presents has got out of control, with a
similar proportion (74%) saying that children should be happy with whatever
they get. Even so, more than half (54%) of parents feel pressured to get
their children the latest toys, gadgets and clothes at Christmas. Almost half (46%) of
parents say they are concerned about their child(ren) being disappointed by
the presents they give them. 44% are further concerned about their child(ren)
comparing their gifts with those received by friends, with 40% concerned
about how they will explain to their child(ren) why Father Christmas didn’t
bring them anything they asked for.
Six in 10 (62%) parents
are concerned about their ability to afford Christmas presents for their
children this year and 40% of parents interviewed said they would be buying
at least one of their children’s presents on credit, because they wouldn’t be
able to afford them otherwise.
Trinh
Tu, Managing Director of Public Affairs at Ipsos,
says: Christmas, a festive season of family, food, and
gifts, can also strain many households financially. Our poll highlights
parents' worry about meeting children's expectations, with over half
expressing this concern and 62% unsure about affording the gift expenses.
Despite concerns about excessive spending, 40% are willing to use credit to
fulfil their children's wishes, indicating prevalent worry about
disappointing their children on Christmas day. (Ipsos MORI) 05 November, 2023
817-821-43-13/Polls Eight In Ten Britons Say
Public Services Have Got Worse Over The Past 5 Years
The latest Ipsos Political
Monitor, taken 1st – 8th November 2023, explores public attitudes towards
Britain’s public services, the economy and tax and spend policies ahead of
the upcoming Autumn Statement. We also update our latest voting intention
figures and leader satisfaction ratings. Attitudes
towards public services Perceptions of public
services in Britain are worsening over time. 78% currently think the quality
of public services has got worse over the past 5 years (including 70% of
Conservative supporters). This compares to 63% who said the same in March
2017 ahead of the General Election later that year, and 40% back in November
2012. Looking forward,
expectations for the future of various aspects of life in Britain are also on
balance pessimistic, and all have got worse since February 2020. In
particular, 64% expect the NHS to get worse over the next few years (up 18
points since February 2020, similar to the previous worst score of 62 per
cent in March 2017). On other areas of public policy:
Overall, 75% (up 5 since
February this year) disagree that in the long term the government’s policies
will improve the state of Britain’s public services (19% agree). This is the
highest figure to be critical of the government’s long-term policies for
public services since the Ipsos series began in 2001. On the other hand, 50%
agree that ‘in the long term, the Labour party’s policies would improve the
state of Britain’s public services, while 39% disagree. Tax
and spend policies and the economy
Voting
intention
Leader
satisfaction ratings
Gideon
Skinner, Head of Political Research at Ipsos, said: Despite all the excitement over Cabinet reshuffles
this week, the longer-term challenge facing Rishi Sunak’s government is
responding to the depth of public concern over the state of Britain’s public
services. There is a widespread belief that public services have got worse
over the last five years – even among Conservative supporters – and little
optimism that they will get better in the future. There is particular worry
for the NHS, which means whilst the Prime Minister looks to be on course to
meet his pledge to halve inflation, this winter may see a focus on his other
pledges to deliver improvements to the health service. With the Autumn
Statement next week, the Chancellor will be looking to rebuild public
confidence in the government’s long-term plans, but against a backdrop of
little public consensus for increasing taxes, cutting spending or increasing
borrowing. (Ipsos MORI) 17 November, 2023 Source: https://www.ipsos.com/en-uk/eight-ten-britons-say-public-services-have-got-worse-over-past-5-years
817-821-43-14/Polls What Do The French Think
Of Napoleon?
The
former emperor is more popular than unpopular in France today, particularly
among men. On November 22, 2023, the
biopic “Napoleon”, by director Ridley Scott, will be released, with Joaquin
Phoenix in the role of the emperor. More
than one in four French people (26%) say they would like to
see the film. The upcoming release of the film raises the following
question: what do the French think of
Napoleon Bonaparte in 2023? Napoleon is more popular
than unpopular in France today: 34% favorable opinion against 21% unfavorable
opinion. Note: 34% of French people are neutral on this subject and 9%
do not comment.
We observe that it is
mainly men who have a favorable opinion of Napoleon: 44% compared to 26% of
women. How
is Napoleon's legacy perceived in France and how should he be remembered? 2021 marked the
bicentenary of Napoleon's death, with controversy over how to commemorate the date , with some calling for celebrations
and others for a boycott. When it comes to how
France should remember Napoleon, the most common answer is "he should be
commemorated as a notable historical figure in a neutral or balanced
way", at 48 % . One
in eight people (13%) believe it should be celebrated, while only 2% believe
it should be condemned, and 8% believe it should not be commemorated at all.
Asked what France should
think of Napoleon's legacy, 32% said the nation should be proud. Only 8%
say that France should be ashamed of it. More than one in three
French people consider that Bonaparte's legacy is "entirely or almost
entirely positive" (9%), and 28% consider it "more positive than
negative". At the same time, 27% find it generally as positive as
negative, 10% think it is entirely negative. In the long term, 31% of
French people think that France's situation has improved thanks to Napoleon,
and 17% consider, on the contrary, that it has deteriorated.
Director Ridley Scott was
criticized for comparing Napoleon to Adolf Hitler and Joseph Stalin . The majority of French
people believe that comparisons with Hitler and Stalin are inappropriate (71%
and 62% respectively). How
do the French describe Napoleon? Unlike other European countries , the word the French most associate
with Napoleon is " ambitious ",
at 43% . The second
most popular word is “authoritarian” (37%), followed by “great general”
(31%).
Only a minority describes
him as a tyrant (11%), a warmonger (9%), a misogynist (5%) or a racist (3%). Napoleon,
a defender of the ideals of the Revolution? When it comes to
Napoleon's legacy and the French Revolution, the question of whether Napoleon
was a defender of the ideals of the revolution or a traitor is still debated
today. According to our study,
twice as many citizens consider Napoleon as a defender of the ideals of the
Revolution (31%) as a traitor (16%).
Napoleon
is less popular with voters on the left than on the right The former emperor seems
less popular on the left than on the right. Indeed, only 26% of French
people who identify most with one of the NUPES parties have a favorable
opinion of Napoleon, compared to 43 to 47% for those who identify most with a
party associated with the Presidential Majority, The Republicans / UDI, or
the National Rally. On the other hand, 38% of
NUPES have an unfavorable opinion of Napoleon, compared to 13 to 17% for
other political groups. This does not mean,
however, that left-wing voters have a completely negative view of
Napoleon. We see that they are more inclined to say that its heritage is
generally positive (38%) than negative (13%), and more likely to say that
France should be proud of its heritage (25%) than ashamed (13% ) - even if
the majority think they should be neither proud nor ashamed (49%). However, they are much
less inclined to consider him as a defender of the ideals of the French
Revolution: 25% compared to 38-45% among other groups of voters.
(YouGov France) 25 October, 2023 Source: https://fr.yougov.com/entertainment/articles/47698-que-pensent-les-francais-de-napoleon
817-821-43-15/Polls 44% Of Companies Struggle
To Recruit Generation Z Talent
The employer brand: a project still to be democratized The employer brand is at
the heart of companies' concerns, in a labor market where attracting and
retaining talent are major issues. The Ipsos x Welcome to the Jungle
barometer reveals that while two thirds of companies operate an employer
branding strategy, the attention paid internally is low: only a third of
employees perceive the efforts put in place by their company. “Attracting and retaining talent are major issues
recognized by everyone today, both by managers and employees. Along with
quality of life at work, this is the area in which companies must develop as
a priority according to their employees (Ipsos Red 2022
survey). Clarifying your employer branding strategy is becoming
essential, which involves both your positioning and the consistency of your
experiences as a candidate, employee or client of the company” declares Anne-
Hélène Fradet, Consulting Director, Ipsos Lead . However, the employer
brand is everyone's business, in a job market where recruitment difficulties
spare no sector. Previously limited to human resources, it is now
embodied by everyone: from managers (25%) to employees (22%) including
marketing teams (22%). However, there are still stakeholders to
mobilize, such as the CoDir (17%) and the Board of Directors (16%). If
companies invest in their employer brand, they struggle to effectively
measure the return on investment of their actions. Thus, almost 20% of
companies do not have measurement tools. Flexibility
and professional development: the two priorities of the employer brand In a very tight job
market, these are ultimately essential criteria which define the
attractiveness of an employer from the point of view of assets to join a
company: competitive health insurance (91%), leave greater than the average
(89%), flexibility in hours or place of work (82%). Good news: HR
decision-makers are rather in tune with these criteria, which they also
consider among the most effective. On the podium of the actions most
commonly implemented by companies to invest in their employer brand, we find
firstly flexibility and the organization of working hours (52%), then
internal professional development which passes through training, coaching or
even mobility (51%), and a working environment conducive to relaxation (47%). We nevertheless observe a
slight dichotomy, with workers who perceive these efforts to a lesser extent
since only 36% consider benefiting from flexibility, and only 31% from a
working environment favoring relaxation. If remuneration (55%) and
quality of life at work (31%) are the first elements cited to plan for the
future company, practices promoting professional development are then the
main motivation lever once in the company . Transparency
at the heart of candidates’ expectations The vast majority of
candidates (75%) expect transparency from companies, mainly in terms of
professional development opportunities (60%) and salary policy
(50%). Job offers with a salary indication obtain 48% more unique
visitors and 22% more applications than those without a salary
range. Furthermore, the culture of feedback should not be reserved for
employees: almost one candidate in two (49%) warns of applications left
without feedback and more than a quarter (26%) denounce long and complex. At
a time when the job search experience has never been so simple and fluid, it
is important to take care of each stage of recruitment for an even richer and
more transparent experience. The
great paradox of employee advocacy They will find this
transparency in sources outside the company, such as social networks (21%),
their personal network (27%) or even online employee review platforms
(21%). However, companies do not invest enough in these channels,
relying on more traditional means (website 31%, recruitment campaigns 25%,
trade fairs 23%). The biggest paradox remains that of employee advocacy
(the practice of making employees ambassadors for the company), which is
totally under-exploited. In fact, 1 in 2 candidates trust employee
testimonials, 6 in 10 workers would be willing to recommend their employer
externally... and yet only 14% of companies capitalize on ambassador programs
to make their employer brand known externally! Among 18-24 year olds,
this is even more true (with 7 out of 10 workers ready to recommend their
employer and 53% trust in their peers). When 44% of companies surveyed
say they have difficulty attracting Generation Z talent, ambassador programs
still have a bright future ahead of them. (Ipsos France) 23 October, 2023 Source: https://www.ipsos.com/fr-fr/44-des-entreprises-ont-du-mal-recruter-des-talents-de-la-generation-z
817-821-43-16/Polls Only 1 In 4 French
Companies Know Exactly About Invoicing Reform
From July 1 , 2024,
all companies, regardless of their size, must be able to receive their
invoices in electronic form. In order to fulfill these obligations, they
will have to opt for a dematerialization platform to exchange their
electronic invoices and transmit their data to the administration. They
will be able to freely choose to use either a private dematerialization
platform or directly to the public invoicing portal. Although a large majority
of French companies believe that this reform will make it possible to fight
VAT fraud more effectively, they are much more doubtful, even critical, about
the direct benefits they will derive from it due to a lack of knowledge of
the subject. However, to date less than a third of French companies have already been in contact with
an actor to support them in implementing the reform and
only 10% of them have subscribed to an offer of 'accompaniement. “ The generalization of electronic invoicing
constitutes a major opportunity, a source of numerous productivity and
performance gains that all companies must seize. »
adds Philippe Marques,
Consulting Partner at Sopra Steria Next . According to the results
of this survey, 75% of the companies questioned say they do not know
precisely the challenges of the electronic invoicing reform which will come
into force next year. The low level of information among companies on
the different aspects of the reform is worrying: 32% say they feel poorly informed on
all the subjects inherent to this platform (registration procedures, data to
be transmitted, precise timetable for the reform, etc. ) and believe that
they will not be able to make the necessary transition by July 1, 2024. This lack of information
differs depending on the size of the companies and is more felt within VSEs,
which as a reminder represent 96% of the economic fabric and more than 4
million companies. Through the Ipsos survey, the bank appears as a
trusted player among more than 60% of VSEs/SMEs. “In order to support any VSE/SME in their
digitalization without creating a digital divide, it is essential to offer a
model that brings together the best of all worlds: universal banking as a
trusted third party and Fintech as a vector of flexibility and capacity to
“adapting to the needs of a rapidly changing world ”
says Neila Choukri, CEO Kolecto,
Crédit Agricole Fintech . 65% of companies say that
the ability to easily integrate into the existing system is the most
important criterion in choosing a partner, ahead of the ease of use of the
solution. (Ipsos France) 08 November, 2023
817-821-43-17/Polls Annual Observatory On
Psychological Well-Being In Italian Companies
76% of Italian workers have experienced at least one
symptom of burnout. 1 in 5 people have been diagnosed. This
is what emerges from the BVA Doxa research commissioned
by Mindwork , the
first Italian company for online
psychological consultancy in the corporate sector which, in
view of World Mental Health Day ,
investigated the psychological well-being of workers in companies operating
in Italy. The research, now in its
fourth edition, is dedicated to the experiences, needs and desires of workers
in companies operating in Italy. A significant figure emerges from the
results: 76% have
experienced at least one of the main symptoms of burnout - feeling
of exhaustion, decrease in work efficiency, increase in mental detachment,
cynicism about work - a percentage growing by +14% compared to last year . The most widespread symptom is the
feeling of exhaustion while for GenZ ,
specifically white collars, the most frequent symptom is the decline in work
efficiency (56%). The research also
investigated the actual diagnosis of
burnout: 1 in 5 people had received it. Nonetheless, the difficulty in taking
time off from work to take care of oneself is widespread, especially among
blue-collar workers: only 19 % more
than 5 days of absence from
work due to this phenomenon. The percentage instead rises for white collar workers (55%) and managers (62%). 58 % of people who experience psychological discomfort in their
personal life also experience the same condition at work and vice
versa. In particular, 1 in 2
people say they suffer from anxiety and insomnia for
work-related reasons . Furthermore,
1 in 2 people experience high stress conditions; given that it appears
even more critical for managers (61%), confirming last year's trend. Unfortunately, again in
continuity with the 2022 data, the work
environment is confirmed as less suitable for expressing
one's discomfort compared to the family context (41%). More than half of those
interviewed say they have left their
job for reasons of emotional distress related to it (54%) during their career, a
phenomenon highlighted for Gen Z and Millennials, in which the percentage
increases by 66% and 59 respectively %. Over 9 out of 10 people
consider the company's promotion
of psychological well-being essential (96%). However,
in 67% of Italian
organizations the psychological support service is not present . Where
available, it is positively evaluated
by 51% of workers
belonging to the blue collar category. There is also a notable increase
in the share of people who would positively evaluate the provision of
the psychological support service
(73%), more precisely in relation to white collars (76%) and blue collars (79%). An indicative figure is
that regarding carers and givers ,
of which 88% declare
that this role has a considerable impact on their psychological
well-being : 6 out of 10 declare
the need for support from
the company in managing their role (59%), although
only 20% feel
they receive it. Similarly, for 89% of workers with children, the parental role has a
significant impact on their psychological well-being. More
precisely, 1 in 2 parents reports
the need for support from
the company in managing their
children (48%). However,
only 25% believe they
will receive it. (BVA Doxa) 08 November, 2023 Source: https://www.bva-doxa.com/osservatorio-annuale-sul-benessere-psicologico-nelle-aziende-italiane/ NORTH
AMERICA
817-821-43-18/Polls Poll Shows Biden Support
Slumping Among Michigan Muslims
A new survey conducted by
one of Joe Biden’s former pollsters shows the president’s support has
cratered among Muslim and Arab Democrats in Michigan, a key demographic group that overwhelmingly backed Biden in
the swing state in 2020. The poll lends further
credence to the warnings Arab and
Muslim community leaders in
Michigan and beyond have been issuing for weeks: that Biden’s handling of the
war in Gaza could cost him a state that he
won by just 150,000 votes in 2020 and is home to an estimated 240,000 Muslims. The survey, shared first
with NBC News, was conducted by Lake Research Partners, a respected
Democratic pollster that did extensive work on Biden’s 2020 campaign and those of
many other major Democratic candidates, like Hillary Clinton. It was
commissioned by Detroit Action, a progressive advocacy group. The survey reached 513
registered, likely Democratic voters in the state, including oversamples of
Arab and Muslim Democrats, and of voters
under the age of 30. It was conducted Oct. 30-Nov. 2 and has a margin of
error of plus or minus 4.9 percentage points. The margin of error is
more than twice as large among the oversampled subgroups, given their small
sample sizes. But only a relative handful of
Arab and Muslim Democrats surveyed, 16%, said they would vote for Biden if
the election were held today. Biden’s performance in
that subgroup put him in a muddled competition with other options including
independent Robert F. Kennedy Jr., former President Donald Trump, independent
Cornel West and the option of “another third-party candidate.” A plurality of
Arab and Muslim Democrats did not register a vote choice in the survey. About two-thirds of Arab and Muslim Democrats said
they now think they will vote to replace Biden, and three-quarters said they
are willing to vote for a third-party candidate. The results appear driven by
the U.S.-backed Israeli campaign in Gaza, with those voters almost
unanimously giving Biden a “poor” rating for his handling of the
Israeli-Palestinian conflict, the most negative response option available. While NBC News exit polls
from 2020 did not ask voters whether they were Arab or Muslim, a national
post-election survey conducted by a major Muslim group found 69% voted for Biden. In Michigan, Biden won 83%
of the vote in the Michigan precincts with the highest concentrations of
Muslim and Arab Americans. And he won 81% of the vote in Hamtramck, the first
Muslim-majority city in the country, which last year elected an all-Muslim city
government. The numbers for Biden are
also challenging among voters under 30, with just 61% saying they would vote
for Biden if the election were held today and 56% giving him a “poor” rating
on the Israeli-Palestinian conflict, according to the survey. About 4 in 10
respondents under 30 years old said they would be willing to vote for a third
party. “Biden’s extremely poor
performance among Arab, Muslim and young voters of his own party is historic
and frightening,” said Waleed Shahid, a progressive strategist who has been
active in the messaging fight around the Gaza war. “Biden is risking handing the
future of American democracy to Trump by providing [Israeli Prime Minister
Benjamin] Netanyahu’s far-right government an unpopular blank check to wage a
reckless war.” Still, the election is a
year away, and at the moment voters may be judging Biden on his own instead
of against his opponents. Trump, for instance, recently revived his plans
to bar many Muslims from entering the U.S. And a group of
Republicans in Congress just introduced a bill that would expel some
Palestinian Americans from
the country by revoking visas issued after Oct. 1, among other actions. And the survey suggests
Biden could win back some Muslim and Arab voters and young Democrats by
working harder to rein in Israel and doing more to support Palestinian
civilians. A majority of all Michigan
Democrats surveyed said they supported a cease-fire, including 92% of Muslim
and Arab Americans and 75% of those under 30. Both subgroups said they would
be more likely to vote for Biden if he supported a cease-fire. Biden has spoken about
about the suffering on both sides of the conflict and called for a
humanitarian “pause” in Israel’s campaign against Hamas to allow more
civilians to leave Gaza and more aid to enter. His administration has been
working to allow more traffic through Gaza’s southern border with Egypt. Overall, Michigan
Democrats were divided on current plans for the U.S. to send $14 billion in
additional military aid to Israel, with a slight plurality supporting it. But
Muslim and Arab and young voters were generally opposed and said they would
be more likely to support Biden if he held back on it. “This poll illustrates
what Detroit Action and members in our community have expressed numerous
times,” said Branden Snyder, the executive director of Detroit Action. “The
plight of these families suffering under a violent, colonial occupation
resonates with our fight for all oppressed people, in the U.S. and abroad.” A New York Times poll
released Sunday found Biden trailing Trump in five critical battleground states,
including by 5 points in Michigan, 43%-48%. While that survey did not break
out results by religion or Arab ethnicity, it showed lower levels of support
for Biden than in the past among young voters and those who identified their
ethnicity as something other than white or Black. (NBC News) 06 November, 2023
817-821-43-19/Polls Palestinians In Gaza At Risk
Before Israel-Hamas War
Thousands of Palestinians
stormed food warehouses in Gaza this week, signaling the growing desperation
among a population that Gallup surveys show was highly vulnerable before the
Israel-Hamas war.
Gaza’s
Population Struggles to Afford Basics Before the recent conflict
began, Palestinians living in Gaza were disproportionately struggling to
afford food. Twice as many people in Gaza (57%) than in the occupied West
Bank and east Jerusalem (28%) said they could not afford food at times in the
past 12 months. The same is true of
shelter. The inability to afford shelter matched its record high in Gaza
before the conflict, with 29% struggling to afford adequate shelter. While
17% who are struggling in the West Bank and east Jerusalem is lower than in
Gaza, it is still high compared with the long-term trend.
According to
Gallup’s Basic Needs Vulnerability Index, which measures people’s ability to afford
food and shelter and their social safety nets, two-thirds of residents in
Gaza (67%) could be classified as highly or moderately vulnerable before the war. Fifteen percent
were highly vulnerable, meaning they struggled to afford both food and shelter and did not have family
or friends who could help them in times of need. Vulnerability will now
likely be even higher as the conflict rages on and people struggle to find
water, food, fuel and shelter. Anger
and Stress High Before Airstrikes Palestinians were also
feeling the strains of daily life before the conflict erupted. More than half
of Palestinians living in Gaza (53%) and 40% in the West Bank and east
Jerusalem reported feeling a lot of
daily stress. Since 2014, daily stress has averaged 54% in Gaza.
Anger was also on the
rise. In summer 2023, 44% of Palestinians in Gaza said they experienced a lot
of anger the day before they were surveyed. This is the highest level of
anger recorded in Gaza since 2018 (48%), when the “Great March of Return”
protests began, which called for an end to the blockade on Gaza and the right
of return for displaced Palestinians. Thousands of Palestinians were killed
and injured in that period.
Anger grew from 31% to 36%
between 2022 and 2023 in the West Bank and east Jerusalem, both sites of
frequent tension, violence and displacement before the current war in Gaza.
From January to September of this year, when fieldwork ended, 2023 had
already become the deadliest year on record in the West Bank for both
Palestinians (189 killed) and Israelis (25 killed). Little
Hope for Youngest Palestinians Before War Gaza’s population is among
the youngest in the world, with roughly half of its residents under the age
of 18. But before the war made their futures even more uncertain, few
Palestinians in either Gaza or the West Bank and east Jerusalem said children
have the opportunity to learn and grow where they live. Those living in Gaza have
been more pessimistic than other Palestinians for the past decade, reaching
28% in 2023. Since Gallup’s World Poll began in 2005, only countries in
conflict such as Iraq, Afghanistan, Yemen, Türkiye, Lebanon, Haiti, the
Central African Republic and the Democratic Republic of Congo have scored
lower than Gaza in 2023 for being a good place for children to learn and
grow.
Bottom
Line Gallup data collected just
before the war in Gaza demonstrate that millions of Palestinians in Gaza and
the West Bank and east Jerusalem were already vulnerable and unable to afford
the basic needs of food and shelter. Measures of stress and anger among both
Palestinians and Israelis are only likely to increase given the events
unfolding in the region. (Gallup) 02 November, 2023 Source: https://news.gallup.com/poll/513662/palestinians-gaza-risk-israel-hamas-war.aspx
817-821-43-20/Polls Majority Now Say U.S.
Losing Ground On Illegal Drug Problem
Americans are more
negative about U.S. progress in dealing with the problem of illegal drugs
than at any prior point in Gallup’s trend, which dates back to 1972. For the
first time, a majority of U.S. adults, 52%, say the U.S. has lost ground in
coping with the illegal drug problem, while a record-low 24% say it has made
progress. Another 23% believe it has stood still.
Drug overdose deaths in
the U.S. have risen sharply in recent years, with much of the increase due to
synthetic opioids like fentanyl. But overdoses linked to other types of
drugs, including cocaine and methamphetamines, have also grown since 2019. Gallup has updated its
trend on progress in addressing the illegal drug problem periodically since
the mid-1990s, after some initial measurements in the 1970s showed mixed
views on the question. The latest results, from
Gallup’s Oct. 2-23 Crime survey, mark a sharp reversal from the prior reading
in 2019. At that time, more Americans were optimistic that progress was being
made (41%) than believed the U.S. was losing ground (30%) in the effort. For
most other recent readings, Americans were divided as to whether things were
improving or getting worse. The public was most
optimistic about the nation’s coping with illegal drugs in 1999 and 2000,
when an average of 47% believed the U.S. was making progress on the issue. Republicans
Especially Likely to See the U.S. Going Backward Republicans are extremely
negative about U.S. progress on illegal drugs, with 12% believing the U.S. is
making progress and 75% losing ground. Independents are also decidedly
pessimistic, with 22% believing progress is being made and 52% thinking the
situation is getting worse. In contrast, more
Democrats think the situation is improving (40%) than worsening (27%). These
party differences underscore the importance of the match between a person’s partisanship
and the incumbent president's party in evaluating the drug situation. Still, partisanship is not
the only factor in worsening evaluations today, as Democrats are less
positive about U.S. progress now under Joe Biden than Republicans were under
Donald Trump in 2019, and Republicans are more negative now than Democrats
were four years ago. Independents are also more pessimistic than they were
then.
Republicans’ assessments
are worse today than in 1996, the previous low, recorded during Bill
Clinton’s administration. That year, 16% of Republicans thought the U.S. was
making progress against illegal drugs and 62% believed it was losing
ground. Independents were also less pessimistic in 1996 than they are today,
with 30% saying the U.S. was making progress and 43% losing ground. Like now,
Democrats were more positive (42%) than negative (36%) with a Democratic
president in the White House. Three-Quarters
in U.S. Describe Drug Problem as Extremely or Very Serious In addition to asking
Americans to gauge U.S. progress against illegal drugs, Gallup asked them to
evaluate the seriousness of the drug problem today, both nationally and in
their local area. Currently, 74% of U.S.
adults describe the drug problem in the nation as either extremely or very
serious, up from 64% the last time the question was asked in 2021 but similar
to the 2019 reading of 73%. The record high of 83% was measured in 2000, the
first year the question was asked. Americans are much less
likely to see the drug problem in their local area as serious, with 35%
saying it is extremely (19%) or very (16%) serious. The current combined
“extremely/very serious” figure essentially ties with the 34% from 2000 as
the highest in the trend, although the percentages have ranged narrowly
between 29% and 35% over the years.
While the 74% describing
the national drug problem as extremely or very serious is not the high point
in Gallup’s trend, the 45% who currently say the problem is extremely serious
is the highest, by two percentage points, over the 43% reading from 2000. Those
are the only surveys to date in which more than 40% said the drug problem was
extremely serious. All
Party Groups See National Drug Problem as Serious Majorities of all party
groups say the U.S. illegal drug problem is serious, including 86% of
Republicans, 74% of independents and 63% of Democrats. Republicans (62%) are
twice as likely as Democrats (31%) to view the problem as extremely serious. Republicans and
independents rate the situation in their local area similarly, with 40% of
Republicans and 37% of independents saying the local drug problem is
extremely or very serious. Democrats, at 27%, are less inclined to believe
this.
The 62% of Republicans who
consider the national drug situation to be extremely serious is the highest
Gallup has measured for any party group to date. The prior high was 49% for
Republicans in 2021. Bottom
Line Amid news of an alarming
spike in the number of U.S. adults succumbing to overdoses of opioids and
other dangerous drugs, Americans generally see little progress in addressing
the illegal drug problem in the nation. The public has never been more
pessimistic than they are today, at least in the years Gallup has collected
data on the matter. Greater concern about U.S. progress could lead to drugs
being a more significant campaign issue in next year’s presidential election
than it has been in recent elections, which would put more pressure on
candidates to devise plans for addressing the problem. (Gallup) 10 November, 2023 Source: https://news.gallup.com/poll/514142/majority-say-losing-ground-illegal-drug-problem.aspx
817-821-43-21/Polls 81% Of U.S. Adults –
Versus 46% Of Teens – Favor Parental Consent For Minors To Use Social Media
More than 40 states and the District of Columbia are
suing Meta, the parent
company of Facebook and Instagram, alleging its platforms purposefully use
addictive features that harm children’s mental health. Amid this news, U.S.
adults and teens are more likely to support than oppose requiring parental
consent for minors to create a social media account and requiring people to
verify their age before using these platforms, according to a pair of new Pew
Research Center surveys. But adults are far more supportive than teens of
these measures, as well as limiting how much time minors can spend on social
media. Here’s a closer look at
the findings from the two new surveys – one of adults and one of teens –
which we conducted in late September through October, before the states’
lawsuit against Meta. Adults’
views on social media policies aimed at minors Most U.S. adults (81%) say
they support social media companies requiring parental consent for minors to
create a social media account. About seven-in-ten favor requiring people to
verify their age before using social media sites (71%) and setting limits on
how much time minors can spend on these platforms (69%). Only about
one-in-ten adults oppose each of these three measures. Still, some adults are
uncertain. For example, roughly one-in-five adults are unsure if companies
should require age verification (18%) or set time limits for minors (17%). Views
among adults by age, party and parental status Many social media companies do not allow those
under 13 to use their
sites. Still, there’s a growing movement to develop stricter age verification measures, such as requiring users to provide
government-issued identification. Legislators have pushed for mandatory parental consent and time restrictions for those under 18, arguing this will
help parents better monitor what their children do on social media. Our survey finds there is
strong bipartisan support for these types of policies. Clear majorities of
Republicans and Democrats – including independents who lean to either party –
support parental consent, time limits for minors and age verification. Majorities of adults
across age groups support social media companies introducing these measures.
But young adults are less supportive than their older counterparts. For
example, 67% of those ages 18 to 29 say social media sites should require
parental consent for minors to create an account, but this share rises to 84%
among those ages 30 and older. Additionally, majorities
of parents and those without children back each of these measures, though
support is somewhat higher among parents. Teens’
views on social media policies for minors Building on the Center’s previous studies of youth and social media, we asked
U.S. teens ages 13 to 17 about their views on these measures. Teens are more likely to
support than oppose social media companies requiring parental consent for
minors to create an account (46% vs. 25%). There’s even more support for
requiring people to verify their age before using these sites – 56% of teens
favor this, while 16% oppose it. But their views are more
divided when it comes to setting limits on how long minors can use these
sites. Similar shares of teens support and oppose this (34% vs. 36%). For each of these
policies, about three-in-ten teens report being unsure if this is something
social media companies should do. How
adults’ and teens’ views on social media policies differ Adults are considerably
more supportive of all three measures we asked about than are teens. While 81% of U.S. adults
support social media companies requiring parental consent for minors to
create an account, that share drops to 46% among U.S. teens. Adults are also about
twice as likely as teens to support setting limits on how much time minors
can spend on social media sites (69% vs. 34%). But majorities of adults
and teens alike support requiring people to verify their age before using
social media sites. But on this, too, adults are more supportive than teens (71%
vs. 56%). (PEW) 31 October, 2023
817-821-43-22/Polls About 1 In 5 U.S. Teens
Who’ve Heard Of Chatgpt Have Used It For Schoolwork
Roughly one-in-five
teenagers who have heard of ChatGPT say they have used it to help them do
their schoolwork, according to a new Pew Research Center survey of U.S. teens
ages 13 to 17. With a majority of teens having heard of ChatGPT, that amounts
to 13% of all U.S. teens who have used the generative artificial intelligence
(AI) chatbot in their schoolwork. Teens in higher grade
levels are particularly likely to have used the chatbot to help them with
schoolwork. About one-quarter of 11th and 12th graders who have heard of
ChatGPT say they have done this. This share drops to 17% among 9th and 10th
graders and 12% among 7th and 8th graders. There is no significant
difference between teen boys and girls who have used ChatGPT in this way. The introduction of
ChatGPT last year has led to much discussion about its role in schools, especially whether schools should integrate the new technology into the classroom or ban it. Teens’
awareness of ChatGPT Overall, two-thirds of
U.S. teens say they have heard of ChatGPT, including 23% who have heard a lot about it. But awareness
varies by race and ethnicity, as well as by household income:
Teens who are more aware
of ChatGPT are more likely to use it for schoolwork. Roughly a third of teens
who have heard a lot about
ChatGPT (36%) have used it for schoolwork, far higher than the 10% among
those who have heard a little about
it. When
do teens think it’s OK for students to use ChatGPT? For teens, whether it is –
or is not – acceptable for students to use ChatGPT depends on what it is
being used for. There is a fair amount of
support for using the chatbot to explore a topic. Roughly seven-in-ten teens
who have heard of ChatGPT say it’s acceptable to use when they are
researching something new, while 13% say it is not acceptable. However, there is much
less support for using ChatGPT to do the work itself. Just one-in-five teens
who have heard of ChatGPT say it’s acceptable to use it to write essays,
while 57% say it is not acceptable. And 39% say it’s acceptable to use
ChatGPT to solve math problems, while a similar share of teens (36%) say it’s
not acceptable. Some teens are uncertain
about whether it’s acceptable to use ChatGPT for these tasks. Between 18% and
24% say they aren’t sure whether these are acceptable use cases for ChatGPT. Those who have heard a lot
about ChatGPT are more likely than those who have only heard a little about
it to say it’s acceptable to use the chatbot to research topics, solve math
problems and write essays. For instance, 54% of teens who have heard a lot about
ChatGPT say it’s acceptable to use it to solve math problems, compared with
32% among those who have heard a little about it. (PEW) 16 November, 2023
817-821-43-23/Polls Majority — Including
Two-In-Five Past Liberal Voters — Say Trudeau Should Step Down
Prime Minister Justin
Trudeau has made clear his intention to lead the party into
the next election, scheduled for 2025. Most voters, including a large portion
of his own party supporters, feel he should step down before the next
election. A new study from the
non-profit Angus Reid Institute finds more than half of Canadians (57%)
holding the view that Trudeau should step down, while three-in-ten (28%) say
he should lead the Liberals into the next election. Importantly, 2021 Liberal
voters are divided, with close to equal numbers saying he should stay on
(44%) or leave the party to a fresh face (41%). The impetus to make a
change may be building, as the Liberals trail the opposition
Conservative Party by 11 points in vote intention. Currently, 39 per cent
would vote for the CPC candidate in their riding, while 28 per cent say the
same of the Liberals. One-in-five (21%) would vote for Jagmeet Singh’s New
Democratic Party. And while Canadian views
of their prime minister after eight years have soured from earlier peaks,
views of opposition leader Pierre Poilievre remain anything but sweet. Fewer
than two-in-five (37%) view Poilievre favourably, largely unchanged over the
last year. Nearly the same number hold a strongly unfavourable view of him
(35%), while about half view him unfavourably overall (49%). But if not Trudeau, then
who? Canadians were asked about five prominent political figures in the
Liberal universe as potential replacements for the long-tenured PM. Minister
of Finance Chrystia Freeland holds the distinction of being the most
well-known, and the most likely to generate support from those who would
consider the Liberal Party in a future election. That said, no strong
consensus exists over who would be the best choice. Close to equal numbers
would prefer former Bank of Canada governor Mark Carney, or current Liberal
cabinet members Anita Anand, Mélanie Joly, or François-Philippe Champagne.
More
Key Findings:
INDEX Part
One: Most say Trudeau should go
Part
Two: Leadership
Part
Three: Vote intention
Part
Four: Who could replace Trudeau?
Part
One: Most say Trudeau should go This has been a turbulent
political period for Prime Minister Justin Trudeau and the Liberal
government, domestically and internationally. At the end of September,
Trudeau told parliament that Indian government agents were linked to the killing on Canadian soil of Hardeep Singh Najjar, a self-proclaimed Sikh nationalist and a
Canadian citizen. The accusation followed a rocky trip for Trudeau to India
for a G20 summit, where Indian Prime Minister Narendra Modi forwent a bilateral meeting with his Canadian counterpart,
and a postponement of a Canadian trade mission to India that was originally
scheduled for October. Trudeau was also forced to apologize after a Ukrainian man who served in a
Nazi unit during the Second World War was given a standing ovation in
parliament in September, though the prime minister’s office noted that it did not know the man
would be invited to parliament. Trudeau said it was Anthony Rota who was
“solely responsible” for the invite; Rota resigned from his position as speaker
of the house. A burgeoning international
conflict between Israel and Hamas now has Trudeau calling for calm, all the while, Canadians navigate
domestic challenges, including a widespread cost of living crisis. Two-in-five
past Liberal voters, majority overall would have Trudeau step down These challenging times
come alongside questions about Trudeau’s future eight years into his tenure as prime
minister. Two years into Trudeau’s third term, and, barring a withdrawal of NDP support, with potentially two years remaining of
Liberal minority governance, a majority feel it is time for a change at the
helm of the party. Approaching three-in-five (57%) Canadians say Trudeau
should step down before the next election. Half that number (28%) disagree,
believing he should be the one who leads the party into the next contest. The sentiment that Trudeau
should step aside before the next election is not confined to one side of the
political spectrum. Those who voted Liberal in 2021 are nearly as likely to
feel Trudeau is the one to lead the party into the next election (44%) as say
it is time for a change (41%):
Men are more likely than
women to feel Trudeau should step down before the next election. However,
majorities of all demographics except 18- to 34-year-old women feel this way:
Part
Two: Leadership Trudeau
records tie for lowest approval of tenure Since a pandemic-era high
of 55 per cent in 2020, approval of Trudeau has trended downwards. Now
three-in-ten (31%) say they approve of Trudeau, matching the low approval
rating seen in August 2019,
as Canadians prepared to head to the polls for the 2019 election with the
clouds of the SNC-Lavalin scandal hanging above the Liberal leader. Women older than 54 are
the most likely to view the prime minister positively. However even in the
group, as many say they strongly disapprove of his performance (41%) as
approve of it (40%). Men older than 34 are the most negative in their
assessment of Trudeau:
Approval of Trudeau peaks
at one-third in Ontario (33%), Quebec (32%) and B.C. (32%). In Saskatchewan
and Alberta, those who disapprove of the prime minister outnumber those who
approve of him by four- and three-to-one, respectively:
Poilievre’s
search for cross-partisan appeal Across the aisle, the man
looking to oust Trudeau does not appear to have made gains as approval of the
PM tumbles. Approaching two-in-five (37%) say they view Conservative leader
Pierre Poilievre favourably, but half (49%) do not. Both figures have shown
little variation since Poilievre took over as leader of the Conservative
party last fall:
Poilievre generates much
of his favourability from those who supported the Conservatives in 2021.
Those who voted Liberal and NDP are much more likely to express negative
sentiments. As the CPC eyes a breakthrough in Quebec, three times as many (58%) past Bloc
voters say they have a negative view of Poilievre as a positive one (19%):
Still, there are many in
Quebec who are unsure. One-in-five (21%) offer no opinion of Poilievre,
suggesting there could be room for improvement for the Conservative leader.
However, majorities in Quebec (54%), Atlantic Canada (54%) and B.C. (53%) say
they view Poilievre negatively. Alberta (55%) and Saskatchewan (56%) are the
only two provinces where a majority say they have a positive impression of
Poilievre:
Comparison
of the leaders Four-in-five (79%) past
CPC voters say they have a favourable view of Poilievre. As many (80%) past
NDP voters say the same of their leader Jagmeet Singh. Trudeau, meanwhile, is
offered praise by a smaller majority – three-in-five (61%) – of his party’s past
voters. In fact, those who voted Liberal in 2021 are as likely to say they
view Singh positively (61%) as Trudeau (61%):
Half of men older than 34
say they view Poilievre favourably; while half of women aged 18 to 54 and men
18-34 say they have positive impressions of Singh. Favourable views of
Trudeau lag his rivals in every demographic except women older than 54, among
whom he is statistically tied with Singh:
Best
prime minister Most Canadians feel
Trudeau is not the best option to lead the country. Three-in-ten (30%) pick Poilievre,
who narrowly edges “none of them” (27%) as the top choice. Half as many say
Trudeau (16%) or Singh (15%). Both the latter men are not the majority choice
for best prime minister among their past party supporters – two-in-five (38%)
who voted Liberal in 2021 say Trudeau is the best option at PM; 46 per cent
of those who voted NDP say Singh. Past CPC voters are much more likely (72%)
to offer an endorsement of their leader:
Regionally, Poilievre is
viewed as Canada’s best option to lead by half in the Conservative
strongholds of Saskatchewan and Alberta. But he also finds himself leading on
this metric across the country, falling to at worst a statistical tie with
Trudeau in Quebec:
Part
Three: Vote intention Increasingly negative
views of Trudeau appear to be a drain on support for the governing Liberals,
who now trail the Conservatives by 11 points in vote intention. Two-in-five
(39%) Canadians say they would vote CPC if an election were held, while
three-in-ten (28%) would vote Liberal. One-in-five (21%) say they would place
their vote with the NDP:
The gap between the two
parties has grown from the seven points seen last fall when Poilievre won
leadership of the Conservatives to the 11 points that now separate the CPC
from the Liberals:
By
region The CPC hold a plurality
of support in B.C., Manitoba and Ontario, and a majority in Alberta and
Saskatchewan. The Liberals lead in only one region in the country – Atlantic
Canada. In Quebec, support is even for the Bloc Québécois (28%) and the
Liberals (29%), with the Conservatives in a close third (23%):
By
age and gender The Conservatives are a
more popular choice among men, while the NDP garner more support from younger
Canadians. The Liberals are in a three-way fight for support among 35- to
54-year-old women, and a two-way battle among women older than 54:
Voter
retention – where have the Liberals gone? Among those who voted
Liberal in 2021, two-in-five (38%) say they aren’t planning to support the
party again if an election were held today. One-in-six (16%) past Liberal
voters say they intend to vote NDP, while one-in-ten (10%) have moved over to
the Conservatives. There are a further one-in-ten (9%) who are either
undecided, will not vote, or prefer not to disclose their choice:
While the NDP appear to
have benefitted the most from Liberal flight, there are a growing number of
Liberals who are shifting to the Conservatives since the 2021 election. In
January 2022, three per cent of 2021 Liberal voters said they would be voting
Conservative in a future election. That proportion has more than tripled
(10%) in the subsequent months:
Part
Four: Who could replace Trudeau? Trudeau has remained
steadfast that he will be the person to lead the Liberal Party into the next
federal election, whether that’s in 2025 or sooner. That said, given the
increasingly challenging political situation, speculation has begun about whether or not another leader
would give the party a fresh look in the eyes of the public. Freeland
most well known, but no clear choice for replacement Canadians were presented
with five high-profile political figures, four who are currently serving in
cabinet, as well as former Bank of Canada governor Mark Carney, who has been linked to the party recently. Canadians are familiar
with Finance Minister Chrystia Freeland, but relatively uncertain about
others, including Minister of Foreign Affairs Mélanie Joly, and President of
the Treasury Board Anita Anand: How
big is the possible vote universe for each party The stakes for any new
Liberal leader are significant. Among the population, 60 per cent say they
would consider that party (including those who already say they would vote
for them). That said, Canadians appear equally open to all three of the major
federal parties, given the right leadership and vision:
Focusing in on the Liberal
vote universe, Chrystia Freeland is the clear preference. Nearly twice as
many within the Liberal sphere choose her compared to any other leader and
this gap grows among those who are most likely to enter the fold, but do not
currently support the party:
(Angus Reid Institute) 18 October, 2023 Source: https://angusreid.org/trudeau-step-down-liberal-leadership-poilievre-carney-freeland/
817-821-43-24/Polls Mortgage Woes Grow: Number
Of Canadians Saying Their Mortgage Is ‘Very Difficult’ To Pay Has Doubled
Since March
It’s spooky season in
Canada with Halloween around the corner, but for many residents the scariest
thing that the next few days could bring is another interest rate hike from
the Bank of Canada. New data from the
non-profit Angus Reid Institute finds the number of mortgage holders
struggling with their monthly payment growing in recent months. One-in-six
(15%) in this group say they find the financial aspect of their mortgage
“very difficult”, a figure that has doubled from data seen in March. The Bank of Canada has
hiked rates only twice since March, but many are still feeling the shock of
the cost of borrowing jumping significantly since the beginning of 2022, when
the BoC’s policy rate was 0.25 per cent. Since then, it has risen to five per
cent. While the expectation from economists reading the
macroeconomic tea leaves is that the BoC will hold rates steady this week,
that does little to quell the concerns many mortgage holders are facing. With
rates as they are, four-in-five homeowners with a mortgage say they are
either worried (40%) or very worried (39%) they will face higher payments
when it comes time to renew with their bank. Those facing renewal in the next
12 months are spooked more than others, with a majority “very worried” (57%)
their monthly payments will rise significantly. Overall, Canadians are
more down than usual on their financial situation and prospects. Half (49%)
say they are in a worse financial position than they were last year, while 35
per cent expect to be in a worse position a year from now. Both figures tie records
seen in more than 13 years of tracking data from the Angus Reid Institute.
More
Key Findings:
INDEX Part
One: Economic issues on the rise
Part
Two: Record levels of economic pessimism
Part
Three: Housing affordability challenges
Part
One: Economic issues on the rise It has been more than 18
months since the Bank of Canada first increased interest rates to combat inflation. The central bank’s goal is to rein in
year-over-year price increases to two per cent, and that apparently has not
been achieved, according to the most recent release from Statistics Canada, showing that inflation year-over-year was
at 3.8 per cent in September. But that figure still
represents positive news in the eyes of economists, and potentially the Bank of Canada, as it considers whether to continue
raising interest rates this week. Inflation has decelerated, especially on
important categories such as groceries, though that deceleration still meant
Canadians were paying 5.8 per cent more for groceries in September than they were in the same month of 2022. For many Canadians, relief
from the rising cost of living can’t come soon enough. Two-thirds (64%) feel
it is one of the top issues facing the country today, putting it far ahead of
health care (46%), the second most chosen concern. Behind that by a considerable
margin is housing affordability (32%), which outpaces climate change (23%),
taxes (19%), and the economy more broadly (18%):
Across the country, the
rising cost of living is the top issue, but it is more prominent according to
the residents of Manitoba (74%), Saskatchewan (73%) and Alberta (69%) than
elsewhere in the country. Only in Atlantic Canada is health care (64%) assessed
as a pressing concern at the same level as the cost of living (65%): Younger Canadians are the
most likely to be fretting over housing affordability. Two-in-five 18- to
34-year-olds feel it is a top issue. Older Canadians are more likely to be
concerned with the state of health care in the country. Meanwhile, men older than
34 select taxes as a top issue at higher rates than other demographics: Housing
affordability rises above climate change as a top issue Housing affordability in
Canada has reached “crisis” levels for some. The federal government has looked to become
more active on this file in recent months, including tying money from the
government’s Housing Accelerator Fund to municipalities to the removal of exclusionary zoning policies. This renewed focus on the
issue from the federal government has come as the issue continues to rise in
prominence. Since September 2022, housing affordability has risen above
climate change as a top concern. There is now an 11-point gap between the two
issues, even after a record summer of wildfires climate scientists believe are linked
to climate change. Related: Canada and the Culture Wars: Most
agree on causes of climate change
Part
Two: Record levels of economic pessimism Half
say they are worse off now than they were a year ago After another year of
dealing with the rising cost of living, half (49%) of Canadians feel they are
worse off now financially than they were a year ago. This matches a previous
record high in 13 years of ARI tracking seen a year ago. One-third (36%) feel they
are in a similar position financially. Prior to the end of 2021, the
proportion of Canadians who felt they were treading water was always above 40
per cent. It has now been below that level consistently in the last two
years.
Inflation has caused a lot
of sticker shock for Canadians over the past two years, but perhaps nowhere
more than the grocery store. Despite the recent cooling of inflation, grocery
prices are still climbing at a higher rate than the average, as noted above. More than half (54%) of
Canadians say they find it difficult to feed their household as these
inflationary pressures persist:
One-third
say they will be worse off one year from now Amidst these economic challenges,
there are many Canadians who have negative views of their financial future.
One-third (35%) believe they will be worse off 12 months from now, tying the
highest level seen in 13 years of tracking data from ARI. Nearly as many
(37%) feel they will at best tread water. One-in-five (19%) see their
finances improving over the next year:
Economic
Stress Index Since the beginning of
2022, the Angus Reid Institute has analyzed a number of key variables
affecting Canadians’ finances – concern over debt, housing costs and grocery
bills, financial appraisals of their recent past and future – to create
the Economic Stress Index (click here to see how it is scored). Currently, one-in-five
(21%) Canadians are found to be Thriving in these economic circumstances,
one-quarter (25%) are Comfortable, one-in-five (22%) are Uncomfortable and 31
per cent are Struggling. In the last two quarters,
there have been elevated numbers of Canadians found to be Struggling by the
index:
The proportion of those
Struggling financially is higher in Manitoba (42%), Alberta (39%) and
Saskatchewan (37%), while there are more in Quebec (26%) who are faring
better than elsewhere in the country:
Canadians aged 35 to 54
are more likely than other age groups to be Struggling according to the
index, including two-in-five (42%) men that age:
Part
Three: Housing affordability challenges Housing – whether it
is rising mortgage payments or rents – continues to pressure Canadians’ budgets. As interest
rates have increased, both owners with mortgages and renters have felt the
squeeze. Overall, two-in-five (43%)
say they find covering their mortgage or rent payment difficult each month,
consistent with figures seen last quarter. More than half (54%) say they find these
monthly costs manageable or easy (see detailed tables). However, there is a gap on
this assessment between renters and homeowners. Renters are more likely to
report difficulties covering their rent – half (53%) describe it as tough or
very difficult to pay – than homeowners their mortgage – 46 per cent say it
is tough or very difficult (see detailed tables). Mortgage
holders report struggles with finances Perhaps evident of the
pressure rising interest rates has placed on mortgage holders, there are a
growing proportion saying they are facing significant challenges paying their
mortgage each month. In March of this year, one-in-12 (8%) mortgage holders
described the financial aspect of their living situation as “very difficult”.
Now double the number – 15 per cent – say the same:
One-third
of mortgage holders say their household debt is ‘major source of stress’ The current economic
environment is also costing many Canadians in other ways. Two-thirds (65%) of
Canadians say they find their household debt level as a minor or major source
of stress. This rises to four-in-five (81%) Canadians who have a mortgage on their
home:
Indeed, two-in-five (38%)
owners with a mortgage are found to be Struggling by the Economic Stress
Index, a proportion similar to renters (36%). Homeowners with no mortgage are
the most likely to be Thriving (37%):
The standard term for a
mortgage in Canada is five years. Between 2018 and 2020, the Bank of
Canada’s policy rate was between one and two per cent. With the rate now at five per cent,
mortgage holders on fixed rates facing renewal now face the possibility of
significant jumps in their monthly payments. Half (50%) of Canadians with a
year or less on their mortgage term are already Struggling by the Economic
Stress Index:
Indeed, many with less
than 12 months left before they need to renew terms on their mortgage already
find their monthly payments difficult to manage. Three-in-five (59%) in this
group say this. Those with two years or more left on their mortgage, who perhaps
locked into more favourable terms, are much more likely to find their
monthly mortgage payments easy or manageable:
Most
worried over terms of next mortgage, especially those renewing within 12
months Still, with Halloween
around the corner, most Canadians with a mortgage are haunted by the spectre
of renewal. Four-in-five (79%) say they are very worried or worried that
their mortgage payments are going to be more expensive when they sign up for
their next five-year term. For those with less than 12 months remaining until
they need to negotiate with their bank, three-in-five (57%) are “very
worried”:
(Angus Reid Institute) 23 October, 2023 Source: https://angusreid.org/mortgage-rates-variable-fixed-canada-increases-economic-optimism-pessimism/
817-821-43-25/Polls Israel-Gaza: Canadians
Share Sympathies With Both Sides In Warzone, Two-Thirds Call For Ceasefire
Much of the world has
watched with a mixture of shock, horror, dismay, and grief over the last
month, as the most recent wave of conflict between Israel and Gaza has caused
the deaths of thousands of innocent civilians. Despite calls for a ceasefire,
the violence that began with an attack by Hamas-led terrorists on Israel has
continued with a sustained air and ground offensive on Gaza by the Israeli
military. New data from the Angus
Reid Institute finds Canadians own responses reflecting the same spectrum of
feelings and opinions that have been expressed internationally. Asked how they view this
conflict, 28 per cent of Canadians say their sympathies lie more with Israel.
After the country was attacked on Oct. 7, more than 1,400 people were killed, and a reported 200 hostages were taken by Hamas – the political
and military organization which governs the Gaza Strip. In response, Israel
launched airstrikes and a subsequent ground offensive, with reports of more than 10,000 Palestinians being killed according
to the Hamas-controlled Health Ministry in Gaza. One-in-five Canadians (18%)
say their sympathies lie more with Palestinians, while a large group –
three-in-ten (31%) – say that they feel equally sympathetic for both sides. Nuance and division are
evident across a varying number of issues surrounding this conflict. While 75
per cent say Gaza’s governing organization Hamas is a terrorist group, nearly
half (47%) say that supporting the Palestinian cause is not the same as supporting
Hamas. Further, four-in-five
(78%) say Israel has the right to exist and to defend itself, but Canadians
are also more likely to say that the Israeli response has been too heavy
handed (45%) than not (36%). More than two-in-five (43%) say Israeli policy
towards Gaza is a form of apartheid, outpacing those who disagree (27%) by a
significant margin. After the Canadian
government abstained from voting on a resolution calling for a temporary
ceasefire in late October, Canadians have organized across the country to call for just that. Most say a
vote in support of pausing hostilities would have been appropriate, with
two-thirds supporting either a temporary (35%) or a full (30%) ceasing of
hostilities.
More
Key Findings:
INDEX Part
One: Where do Canadians’ sympathies lie? Part
Two: Assessing the government and media response Part
Three: Conflicting opinions
Part
Four: Conflict, protest, and free speech
Part
Five: The future: is lasting peace even possible?
Part
One: Where do Canadians’ sympathies lie? The conflict in Israel and
Gaza has dominated the media landscape in the weeks since Oct. 7, when
Hamas-led terrorists breached the Gaza Strip border fence and proceeded to
kill 1,400 Israelis, mostly civilians, and reportedly kidnap 200 more.
Israel’s response has been an aerial and ground assault on Gaza with a goal
of eliminating Hamas, the political and military organization which governs
the Gaza strip. More than 10,000 people have died in Gaza since the conflict
began, according to the Ministry of Health in Gaza, which does not distinguish between Hamas
fighters and civilians in its death counts. However, more than half of the dead in Gaza are women and children. Four-in-five (80%)
Canadians say they’ve been having conversations with their friends and
families after the most recent wave of violence in the Israel-Palestine
conflict, including two-in-five (41%) who say they’ve been following the news
very closely and discussing it regularly. One-in-six (17%) say they’ve only
been scanning headlines, while two per cent have heard nothing about it (see detailed tables). Canadians are split over
where their sympathies lie. The largest group – three-in-ten (31%) – say they
have equal appreciation of both the Israeli and the Palestinian side in the
conflict. Nearly as many (28%) say they have more sympathy for the Israelis,
while one-in-five (18%) are more sympathetic to the Palestinians. Women aged 18- to
34-years-old are the most likely demographic to say they sympathize more with
the Palestinian side, while men older than 54 are the most likely to side
with the Israelis. In all other age gender groups, the largest group say
their sympathies are equally with both sides in the conflict:
Half (48%) of those who
say they would vote Conservative if an election were held today say they side
with the Israelis in the Israel-Palestinian conflict. Those who intend to
vote NDP are the most likely to be on the other side, with more than
one-third (36%) saying they side more with the Palestinians. A plurality of
likely Liberal (36%) and Bloc Québécois voters (46%) find themselves with
equal sympathies for both sides:
A subsample of Canadian
Muslims and Jews better capture their perspectives on this conflict.
Four-in-five (78%) Muslims say their sympathies lies with the Palestinians,
while four-in-five (78%) Jews say theirs lie with the Israelis. Among both
religious groups, one-in-six say they sympathize with both sides of the
conflict:
*Please
note, while helpful in adding context and information to this story, these
subsamples of Canadian Jews and Muslims are not necessarily representative of
each group in Canada nor weighted to appropriate demographic categories and
should be reviewed with caution. One-in-ten (11%) Canadians
say their opinions have changed in the weeks since the Oct. 7. Those whose
assessments have shifted are more likely to say they are now more sympathetic
to the Palestinians (7%) than the Israelis (4%). Those who say they would vote
for the Bloc Québécois if an election were held today are the most likely to
say their opinions have changed since Oct. 7. One-in-eight (12%) in that
group say their sympathies are now more with Palestinians:
Part
Two: Assessing the government and media response The Canadian government
has faced both support and criticism for its response to the conflict. Canada was one of 14
countries to abstain from a UN vote calling for a “humanitarian truce” in the Israel-Palestine “crisis”. It has also provided $60 million in humanitarian aid to Palestinians in the Gaza Strip.
Meanwhile, more than 400 Canadian citizens remain trapped in Gaza, awaiting the
chance to leave the country at the Rafah border crossing into Egypt, the only
crossing open to foreign nationals who wish to flee Gaza. The Canadian
government says it has no information as to when its citizens will be able to
leave Gaza but has said the Israeli military has assured Canadians trapped
will be able to leave in the coming days. Ottawa has also been
steadfast in its support of Israel’s “right to defend itself”, while condemning Hamas. In the early
weeks of the conflict, Canada evacuated more than 1,600 people from Israel,
including Canadian citizens, permanent residents and eligible family members. Canadians are divided in
their assessment of the government and Trudeau’s response. One-quarter say both
the government (26%) and Trudeau (26%) has been too pro-Israel. A similar
sized group believe both Trudeau (22%) and the government (23%) have struck
the right balance. One-in-six say Trudeau (17%) and the government (15%) have
been too pro-Palestinian. The media coverage draws
split assessments from Canadians. One-quarter (27%) believe mainstream media
organizations have struck the right balance in reporting both sides of the
conflict. One-in-five (23%) say media coverage has sided too much with Israel
while 19 per cent believe it has sided too much with Palestinians:
Canadians younger than 55
are more likely to believe Trudeau’s response has been too pro-Israel. Men
are twice as likely as women to believe instead it has been too
pro-Palestinian. Notably, a larger proportion of women (41%) than men (25%)
are unsure on the matter (see detailed tables). One-third (35%) of those
who say they would vote Conservative if an election were held in the near
term say Trudeau has been too pro-Palestinian in his response to the
conflict. Two-in-five (39%) likely NDP and one-quarter (25%) likely Liberal
voters disagree, saying instead the Trudeau’s response has been too
pro-Israel. Those who would vote Liberal if an election were held are the
most likely (35%) to say the prime minister has struck the right balance:
Canadian Muslims and Jews
offer divergent assessments of the government and media response. More than
two-thirds of Muslims believe major news organizations, Trudeau and the
Canadian government have been siding too much with Israel during the
conflict. Three-in-five Jews (59%) say Canadian media has been too
pro-Palestinian, while they are more split in their assessments of the
government and Trudeau:
Part
Three: Conflicting opinions Vast
majority say Israel has a right to defend itself With little equivocation,
the vast majority of Canadians (78%) agree that Israel has a right to exist
and defend itself. Majorities of all demographics believe this, though
agreement ranges from three-in-five (59%) among 18- to 34-year-old women to
nearly all (92%) of men older than 54 (see detailed tables). Among likely voters, a
majority across the political spectrum also say Israel has the right to exist
and defend itself. The majority is smallest among those who say they would
vote NDP (69%):
Hamas
viewed as a terrorist group by most Three-quarters of
Canadians (75%) also say Hamas is a terrorist organization. (Hamas is
designated as a terrorist organization by the Canadian government.) Younger Canadians, and women, are less
likely to agree but still do so at a majority level (see detailed tables).
But
more say Israel’s response has been ‘too heavy handed’ than not Canadians lean towards
believing Israel’s response to the Hamas Oct. 7 attack has been too heavy
handed (45%) than not (36%). Half of men older than 54 (52%) disagree
Israel’s response has been too strong, while a majority of women aged 18- to
34-years-old are inclined to believe the response has been disproportionate:
Even among those who feel
that Israel’s place in the middle east and right to defend itself is
sacrosanct are divided evenly about the response:
Meanwhile, Canadians are
more likely to agree (43%) than not (27%) that Israel’s policy towards
Palestinians is a form of apartheid, an allegation levelled by some human rights
organizations including Amnesty International. Former U.S. president Jimmy Carter titled
his 2006 book on the situation Palestine: Peace Not Apartheid, to much criticism at the time. Those who would vote Conservative if an
election were held soon are more likely (45%) to disagree with that
categorization of Israel’s policies than likely Liberal (22%), NDP (11%) or
Bloc Québécois voters (13%, see detailed tables).
Part
Four: Conflict, protest, and free speech Much of the discourse
surrounding this issue has been centred on who supports whom, with criticism
being levelled on both sides by those who disagree with them, for perceived
missteps and partisanship. In one high-profile incident, Ontario NDP MPP
Sarah Jama was removed from the party’s caucus and heavily criticized for a
statement that centred on ending the “occupation of all Palestinian land” and
that did not reference or condemn the Hamas attacks. Supporting
Palestinians not seen by most as supporting Hamas For most (47%), voicing
support for Palestine is not the same as supporting Hamas, but for a
significant portion (29%) these are one in the same. Another one-quarter
(24%) are not sure one way or the other. There is a sharp divide on
this issue between those who profess practicing Islam versus those who
practice Judaism:
All age groups are more
likely to say that it is unfair to equate support of Palestine with support
of Hamas, but older men are most likely to say this is equivalent (see detailed tables). Protesting
in support of Israel more likely to be viewed as supporting Israeli
government Canadians are more likely
to connect public support for Israelis with their current government than
they are to equate Gazans with Hamas. In the former case, 42 per cent say
that protesting in support of Israel is the same as supporting the Israeli
government and its actions. One-in-three (33%) say this is a false dichotomy,
while one-quarter are again, unsure. Two-thirds of Muslim
Canadians say demonstrating for Israel is the same as advocating for the
government’s actions, while 37 per cent of Canadian Jews agree. The majority
of this latter group disagree:
Canadians
push for more tolerance of expression Whichever side they find
themselves on, many Canadians hold the view that unpopular or sensitive
views, as long as they do not invoke hate speech, should be tolerated rather
than punished. This is a relatively uniform view across all age and gender
groups, though older Canadians are more likely to say that there are some
things that should just not be said about the ongoing conflict:
Part
Five: The future: is lasting peace even possible? Division
between support for temporary or permanent halt to conflict Protestors across
Canada in recent days have called for a ceasefire in the
conflict between Israel and Hamas. The Canadian government has called for
a “humanitarian truce” after abstaining from the UN vote
which called for exactly that. Israel has argued that a ceasing of its
operations will allow for a re-strengthening of Hamas, while those in favour of a ceasefire say
that innocent civilians are being starved and killed, unable to access medical services and
other necessities. A majority of Canadians
(65%) believe a ceasefire should be called, while one-in-five (19%) do not
support one. However, those in favour of a ceasefire find themselves split
between believing only a temporary one is necessary (35%) and believing a
full and lasting one should be called (30%):
There is shared belief
that a ceasefire should be called even among different groups of likely
voters. Those who say they would vote Conservative are the most likely (35%)
to believe a ceasefire should not be called, but still half (51%) support
one. Support is higher among likely Liberal (74%), NDP (82%) and Bloc (73%)
voters: Little
hope for long-term peace As violence continues in
Israel and Gaza, the ideal of peace between Israelis and Palestinians seems
unlikely to a majority of Canadians. Approaching two-thirds (63%) believe
there is no chance for a enduring peaceful resolution between the Israelis
and Palestinians. One-in-six (15%) still hold out hope, but that represents a
significant decline in optimism from almost 30 years ago, when Canadians were
more divided in believing peace was possible (38%) and not (40%):
Majorities of Canadian
Jews (55%) and Muslims (61%) believe there is no chance for lasting peace
between Israelis and Palestinians. However, both groups are slightly more
optimistic (Muslims 26% yes, Jews 19%) than the general population (15%):
(Angus Reid Institute) 07 November, 2023 Source: https://angusreid.org/israel-palestine-canada-trudeau-gaza-ceasefire/ AUSTRALIA
817-821-43-26/Polls Over 1.57 Million
Australians Are Now ‘At Risk’ Of ‘Mortgage Stress’ Representing 30.3% Of
Mortgage Holders
New research from Roy Morgan shows a record high 1,573,000
mortgage holders (30.3%) were ‘At Risk’ of ‘mortgage stress’ in the three
months to September 2023. This period encompassed three RBA meetings at which
interest rates were left unchanged. The figures for September
represent a new record high, up 7,000 on a month ago. Over
760,000 more households at risk of mortgage stress after a year of interest
rate increases The number of Australians
‘At Risk’ of mortgage stress has increased by 766,000 since May 2022 when the
RBA began a cycle of interest rate increases. Official interest rates are now
at 4.1% in October 2023, the highest official interest rates since May 2012,
over a decade ago. The number of Australians
‘At Risk’ of mortgage stress (1,573,000) is at a record high. The proportion
of mortgage holders at 30.3% remains below the record highs reached during
the Global Financial Crisis of 15 years ago because of the larger size of the
Australian mortgage market today. The record high of 35.6% of mortgage
holders in mortgage stress was reached in mid-2008. The number of mortgage
holders considered ‘Extremely At Risk’, is now numbered at 1,043,000 (20.5%)
which is now significantly above the long-term average over the last 15 years
of 15.3%. Mortgage
Stress – Owner-Occupied Mortgage-Holders
Source:
Roy Morgan Single Source (Australia), average interviews per 3 month period
April 2007 – September 2023, n=2,759. Mortgages
‘At Risk’ set to increase to over 1.58 million if RBA raises rates by +0.25%
in November Roy Morgan has modelled
the impact of two potential RBA interest rate increases of +0.25% in both
November (+0.25% to 4.35%) and December (+0.25% to 4.6%). In September, 30.3% of
mortgage holders, 1,573,000, were considered ‘At Risk’ and this would
increase to 30.4% of mortgage holders by November 2023 if the RBA increases
interest rates next week. If the RBA raises interest
rates by +0.25% in November to 4.35%, there will be 30.4% (up 0.1% points) of
mortgage holders, 1,581,000, considered ‘At Risk’ in November 2023 – an
increase of 8,000. If the RBA raises interest
rates by a further +0.25% in December to 4.6%, there will be 31.0% (up 0.7%
points) of mortgage holders, 1,612,000, considered ‘At Risk’ in December 2023
– an increase of 39,000. Mortgage
Risk at different level of interest rate increases in November & December
2023
Source:
Roy Morgan Single Source (Australia), July – September 2023, n=3,836. Base: Australians 14+ with owner occupied
home loan. How
are mortgage holders considered ‘At Risk’ or ‘Extremely At Risk’ determined? Roy Morgan considers the
risk of ‘mortgage stress’ among Mortgage holders in two ways: Mortgage holders are
considered ‘At Risk’ [1] if their mortgage repayments are greater than a certain
percentage of household income – depending on income and spending. Mortgage holders are
considered ‘Extremely at Risk’ [2] if even the ‘interest only’ is over a certain proportion
of household income. Unemployment
is the key factor which has the largest impact on income and mortgage stress It is worth understanding
that this is a conservative model, essentially assuming all other factors
remain the same. The latest Roy Morgan unemployment estimates for September
show almost one-in-five Australian workers are either unemployed or
under-employed – 2,893,000 (18.9% of the workforce); (‘Real’ unemployment drops to 10.2% in
September – now 2.9 million are unemployed (1.6 million) or under-employed
(1.3 million)) – an
increase of 129,000 (+0.3% points) on a year ago. While all eyes are on
interest rates the greatest impact on an individual, or household’s, ability
to pay their mortgage is not interest rates, it’s if they lose their job or
main source of income. Michele
Levine, CEO Roy Morgan, says mortgage stress increased to a new record high
in September with 1,573,000 mortgage holders considered ‘At Risk’ of mortgage
stress as the RBA’s series of 12 interest rate increases continue to flow
through to the wider mortgage market: “The
latest Roy Morgan data shows mortgage stress in the Australian housing market
has increased to a new record high of 1,573,000 mortgage holders defined as
‘At Risk’ in September 2023. This represents a substantial increase of
766,000 mortgage holders since the RBA began a record-breaking series of
interest rate increases nearly eighteen months ago in May 2022. “The
figures for September 2023 take into account all twelve RBA interest rate
increases which lifted official interest rates from 0.1% in May last year to
4.1% by June 2023. Since then, the RBA has decided to leave interest rates
unchanged at its last four meetings. “The
RBA’s decision to leave interest rates unchanged in recent months came as
inflation decreased compared to earlier this year. However, in recent months
inflation has ‘reaccelerated’ and moved upwards. The latest ABS CPI
monthly figures for the year to September 2023 show Australian inflation at
5.6%, up 0.4% points from August and up 0.7% points
over the last two months. “This
is the first time official inflation has increased for two straight months so
far this year – the last time was at the cyclical peak in December 2022 at
8.4%. The increases to inflation are not surprising though considering the
increase in energy and fuel prices in recent months. “The
average retail petrol price has averaged above $1.90 per litre for a record
12 straight weeks since early August – beating a previous record run at such
a high price in May-July 2022. During mid-2022 Inflation Expectations
increased rapidly from 5.3% to 5.9% – up 0.6% points. The latest
weekly Inflation Expectations data for mid-October shows the measure at 5.2%
for the week to October 29 – up 0.3% points since
mid-September and averaging 5.3% over the last four weeks. “The
increases to petrol prices are being driven by a decline in the value of the
Australian Dollar which dropped below 63 US cents in mid-October to its
lowest since November 2022. As long as the Australian Dollar stays low, and
petrol prices stay high and even increase further, there will be additional
inflationary pressures in the economy. “These
pressures are adding to calls for the RBA to raise interest rates again and
are a key factor for why we have modelled two further interest rate increases.
If the RBA does raise interest rates next week by 0.25%, Roy Morgan forecasts
mortgage stress is set to increase to over 1.58 million mortgage holders
(30.4%) considered ‘At Risk’. “Of
even more concern is the rise in mortgage holders considered ‘Extremely At
Risk’, now estimated at 1,043,000 in September 2023. This figure has more
than doubled since the RBA began raising interest rates, representing an
increase of over 560,000 mortgage holders. “When
considering the data on mortgage stress, it is always important to appreciate
interest rates are only one of the variables that determines whether a
mortgage holder is considered ‘At Risk’. The variable that has the largest
impact on whether a borrower falls into the ‘At Risk’ category is related to
household income – which is directly related to employment. “The
latest figures on mortgage stress show that rising interest rates are causing
a large increase in the number of mortgage holders considered ‘At Risk’ and
further increases will spike these numbers even further. If there is a sharp
rise in unemployment, mortgage stress is set to increase even more.” (Roy Morgan) 31 October, 2023 Source: https://www.roymorgan.com/findings/mortgage-stress-risk-october-2023
817-821-43-27/Polls Over 3 Million Australians
Were Either Unemployed (1.54 Million) Or Under-Employed (1.58 Million) In October
– Highest For Three Years
In October 2023 a massive 3.12 million Australians were
unemployed or under-employed (20.1% of the workforce) – the highest figure
for three years since October 2020, according to the latest Roy Morgan
employment series data. ‘Real’ unemployment was
down 0.3% to 9.9% - an estimated 1,542,000 Australians in October. There were
more people looking for part-time jobs (up 92,000 to 936,000) but many fewer
people looking for full-time jobs (down 114,000 to 606,000) compared to a month
ago. In
addition, there were a further 1,577,000 Australians (up 248,000) now
under-employed – a record high figure for the under-employed, exceeding the
previous record of 1,562,000 in September 2022. The October Roy Morgan
Unemployment estimates were obtained by surveying an Australia-wide cross
section of people aged 14+. A person is classified as unemployed if they are
looking for work, no matter when. The ‘real’ unemployment rate is presented
as a percentage of the workforce (employed & unemployed).
Australian employment
increased by 204,000 to a new record high of 13,959,000 in October. The
increase was due to a rise in both full-time employment, up 46,000 to
9,009,000 and a large increase in part-time employment, which was up 158,000
to a new record high of 4,950,000.
In October 1,542,000
Australians were unemployed (9.9% of
the workforce), a decrease of 22,000 from September. There were
606,000 (down 114,000) looking for full-time work but 936,000 (up 92,000) now
looking for part-time work.
The workforce in October
was 15,501,000 (up a large 182,000 from September, and up a massive 671,000
from a year ago) – comprised of 13,959,000 employed Australians (up 204,000
from a month ago) and 1,542,000 unemployed Australians looking for work (down
22,000).
In addition to the
unemployed, a record high 1.58 million Australians (10.2% of the workforce)
were under-employed, i.e. working part-time but looking for more work, up
248,000 from September. In total 3.12 million Australians (20.1% of the
workforce) were either unemployed or under-employed in October. Compared
to early March 2020, before the nation-wide lockdown, in October 2023 there
were almost 1 million more Australians either unemployed or under-employed
(+4.5% points) even though overall employment (13,958,000) is over 1 million
higher than it was pre-COVID-19 (12,872,000). ABS
Comparison Roy Morgan’s unemployment
figure of 9.9% is almost triple the ABS estimate of 3.6% for September but is almost identical with the
combined ABS unemployment and under-employment figure of 10.0%. The latest monthly figures
from the ABS indicate that the people working fewer hours in September 2023
due to illness, injury or sick leave was 563,000. This is around 65,000
higher than the pre-pandemic average of the six years to September 2019
(499,330) – a difference of 63,670. If this higher than
pre-pandemic average of workers (63,670) is added to the combined ABS
unemployment and under-employment figure of 1,464,000 we find a total of
1,527,670 people could be considered unemployed or under-employed, equivalent
to 10.4% of the workforce. Roy
Morgan Unemployment & Under-employment (2019-2023)
Source: Roy Morgan Single Source January 2019 – October
2023. Average monthly interviews 5,000. Michele
Levine, CEO Roy Morgan, says total Australian unemployment and
under-employment has increased to over 3 million in October – the highest for
exactly three years: “The
latest Roy Morgan employment estimates for October show 1,542,000 Australians
were unemployed (9.9% of the workforce) and a further 1,577,000 were
under-employed (10.2%). “These
figures combined show a massive 3.12 million Australians were either
unemployed or under-employed (20.1% of the workforce) in October. This is the
largest pool of under-utilised labour in the Australian economy for exactly
three years since October 2020 when Victoria was in an extended lockdown and
many State borders were closed. “A
big reason for these increases is simply the rapid increase in the size of
the Australian population over the last year – a record high annual increase
of 785,000 since October 2022. This is around three times larger than the
long-term average over the last 25 years during which the Australian
population increased on an annual basis by an average of 276,000. “The
surging population has led to increases in employment metrics across the
board. The Australian workforce has increased by a near-record 671,000 from a
year ago to a record high of over 15.5 million for the first time. The
workforce increases have been spread between the employed, up a large 491,000
from a year ago to 13,959,000 (a new record
high level of employment), and the unemployed, up 180,000 to
1,542,000. “As
the Australian population and workforce has grown, both employment and
unemployment have grown as the economy has been unable to find new jobs for
all those who need them. Compared to a year ago, overall unemployment and
under-employment has increased by a combined 203,000 to 3,119,000 including a
record high level of under-employment. “The
high net immigration has kept Australia out of a recession over the last two
years, but the Reserve Bank of Australia (RBA) has noted that the population
surge is adding to inflationary pressures in the economy. RBA: Minutes
of the Monetary Policy Meeting of the Reserve Bank Board (April 2023): ‘Although
higher immigration might reduce wage pressures in industries that had been
experiencing significant labour shortages, members noted that the net effect
of a sudden surge in population growth could be somewhat inflationary for a
period.’ “The
RBA’s decision to raise interest rates by 0.25% to 4.35% this week indicates
concerns about inflation are still present and may lead to further interest
rate increases. If the RBA continues to raise interest rates in the months
ahead this will put further pressure on businesses and work to cool the
economy in 2024 with fewer new jobs being created. “The
high level of unemployment and under-employment (at a three-year high above
3.1 million) must be the number one
priority for the Federal Government over the next year. There
will be increasing pressure on the economy to continue creating jobs with
persistently high inflation (ABS:
5.4% in the 12 months to September 2023) and
the highest interest rates for over a decade since December 2011.” (Roy Morgan) 08 November, 2023 Source: https://www.roymorgan.com/findings/9368-australian-unemployment-estimates-october-2023
817-821-43-28/Polls Australians Are Evenly
Divided On Whether Israel Should Withdraw Their Armed Forces From Gaza
Immediately Or Not
Now 51% of Australians say the Israeli army should
withdraw their armed forces from Gaza immediately, while 49% say they should
not, according to a special Roy Morgan Snap SMS survey conducted with a
cross-section of 1,650 Australians aged 18+ from Thursday November 9 – Monday
November 12, 2023. They were asked: “Turning to the current conflict in the
Middle East between Israel and Hamas in Gaza. In your opinion should the
Israeli army withdraw their armed forces from Gaza immediately or not?” Respondents
were then asked: “And why do you say that?” Respondents
who said ‘Yes’ mentioned the disproportionate
impact on civilians and the humanitarian crisis, that over 99% of casualties
and deaths have been civilians, that too many innocent are being killed and
that it’s time to sit down and talk. The respondents said that they are
implementing atrocities against civilians and children and that their actions
are beyond cruel. Other proponents of an
immediate withdrawal said that Israel has occupied Palestine for far too long
and that Palestine needs to be free and that it is not Israeli land and that
they are engaging in a genocide and that ‘war crimes are war crimes on both sides’
– the initial attack doesn’t justify the current actions of the IDF. Respondents
who said ‘No’ mentioned that Hamas has not yet
been defeated and still have hundreds of hostages in Gaza – nearly all
innocent civilians. For there to be any withdrawal the hostages must first be
released. The respondents said that Israel has a right to defend themselves
after being attacked and that it would not be safe to withdraw immediately. Other respondents noted
that if Hamas is not defeated they will reform and attack again in future and
that Israel needs to be allowed to ‘finish the job’. Respondents noted that
‘Hamas started the war, let Israel finish it’ and that ‘Hamas are terrorists’
and that terrorism must be ‘stamped out by eliminating the terrorists’. Women
and Australians under 50 support immediate withdrawal, men and Australians
over 50 don’t There is a clear gender
split on the question with a large majority of women (64%) saying Israel
should withdraw their armed forces immediately from Gaza compared to only 41%
of men. There is a similar dynamic
by age with 65% of people aged 18-34 and 61% of those aged 35-49 saying
Israel should withdraw their armed forces immediately compared to only 47% of
people aged 50-64 and just 39% of those aged 65+. ALP
and Greens supporters want an immediate withdrawal, Coalition supporters
don’t There is a clear political
divide on the question of withdrawal from Gaza. A large majority of 93% of
Greens supporters and almost two-thirds of ALP supporters (64%) say that
Israel should withdraw their armed forces from Gaza immediately. In addition,
75% of those who support Independents say that Israel should withdraw their armed
forces from Gaza immediately. In contrast, a large
majority of Coalition supporters (75%) and One Nation supporters (78%) say
that Israel should not withdraw their armed forces from Gaza immediately. In
addition, 57% of those who support Other Parties say that Israel should not
withdraw their armed forces from Gaza immediately. NSW
and Victoria support withdrawal, WA and SA don’t, while Queensland is split
50:50 on withdrawal Australia’s mainland
States are split on the question of withdrawal from Gaza. A majority of respondents
in New South Wales (54%) and Victoria (51%) say that Israel should withdraw
their armed forces from Gaza immediately. In contrast, a majority of
respondents in South Australia (58%) and Western Australia (57%) say that
Israel should not withdraw their armed forces from Gaza immediately. Queensland is split down
the middle on the question with 50% supporting withdrawal and 50% against. Support
for an immediate Israeli withdrawal of their armed forces from Gaza by State:
Australians surveyed were
each asked the following question:
(Roy Morgan) 13 November, 2023
817-821-43-29/Polls Roy Morgan Business
Confidence Up 3.3pts To 90.4 In October – Before The RBA Raised Interest
Rates Again To 4.35%
In October 2023 Roy Morgan Business Confidence was
90.4 (up 3.3pts since September). This increase to Business Confidence came
before the RBA increased interest rates by 0.25% on Melbourne Cup Day to
4.35% - the highest official interest rates have been since December 2011. Business Confidence has
now spent a record nine consecutive months below the neutral level of 100,
the longest stretch in negative territory in the history of the index dating
back over a decade to 2010. A majority of businesses
are worried about the performance of the Australian economy with 56.5%
expecting ‘bad times’ for the economy over the next year and even more,
58.2%, expecting ‘bad times’ for the economy over the next five years. Nevertheless, businesses
remain relatively positive about their own prospects over the next year with
40.1% saying they will be ‘better off’ financially this time next year
compared to only 29.2% that say they will be ‘worse off’ – a positive net
rating of 10.9% points and the only index in positive territory. Business Confidence is now
21.1pts below the long-term average of 111.5 but a large 16.1pts higher than
the latest - ANZ-Roy Morgan Consumer Confidence of 73.4
for November 6-12, 2023. Roy
Morgan Monthly Business Confidence - Australia
Source: Roy Morgan Business Single Source, Dec 2010-Octt.
2023. Average monthly sample over the last 12 months = 1,523. Business
Confidence is down from a year ago – largest falls in NSW and South Australia Although Business
Confidence increased by 3.3pts in October to 90.4, compared to a year ago the
measure has dropped by 6.2pts (-6.4%) since October 2022. The big fall in Business
Confidence from a year ago has been driven by falls in Australia’s two
largest States of NSW and Victoria as well as falls in South Australia and
Tasmania. In contrast, there were increases in both Queensland and Western
Australia compared to a year ago. Business Confidence is now
lowest of all in South Australia at only 51.0 in October, down a large
41.7pts (44.9%) from a year ago – clearly the largest drop of any State.
Business Confidence is also well below the national average in Victoria at
only 84.8, down 4.5pts (-5.1%) from a year ago. In Australia’s largest
State of New South Wales Business Confidence has fallen by 11.4pts (-11.1%)
from a year earlier to 91.6 – and is now just above the national average of
90.4. Business Confidence is now
clearly the highest in Western Australia at 120.3, up 8.3pts (+7.4%) from a
year ago. Business Confidence in Western Australia has averaged over 120 so
far during 2023 – nearly 30pts above the national average. Other States with
higher-than-average Business Confidence in Tasmania at 95.7, but down 4.8pts
(-4.8%) from a year ago, and in Queensland at 92.5, following an increase of
7.2pts (+8.4%). Business
Confidence by State in October 2022 vs October 2023
Source: Roy Morgan Business Single Source, October 2022,
n=1,693, October 2023, n=1,805. Base:
Australian businesses. *Tasmanian Business Confidence is measured over two
months: Sept-Oct. 2022 cf. Sept-Oct. 2023. Administration
& Support Services and Education & Training are the most confident
industries in October while the least confident industries are Retail and
Agriculture Over the last two months
only eight industries, Administration & Support Services, Education &
Training, Electricity, gas & water, Information Media &
Telecommunications, Public Administration & Defence, Manufacturing,
Finance & Insurance and Community services had Business Confidence in
positive territory above the neutral level of 100. The most confident
industry in September-October was Administration & Support Services with
a Business Confidence of 127.2, an increase of 19pts (+17.5%) on a year ago.
This is the most confident the industry has been for over two years since
mid-2021. Education & Training
is the second most confident industry with Business Confidence of 120.6, an
increase of 1pt (+0.8%) on a year ago. Education & Training has been
amongst the top two most confident industries throughout 2023 and has an
average Business Confidence of 123.1 so far this year, over 30pts higher than
the national average. In third place is
Electricity, gas & water with Business Confidence of 118.2, following a
large increase of 30.9pts (+35.4%) on a year ago, ahead of Information Media
& Telecommunications on 113.5 and up 1.1pts (+1.0%). The two industries which
have experienced the largest increases in Business Confidence over the last
year are Public Administration & Defence, up 32.3pts (+40.8%) to 111.3
and Finance & Insurance following an increase of 34.7pts (+52.5%) on a
year ago to be just in positive territory at 100.9. Other industries to
improve their confidence compared to a year ago include Manufacturing, up
2.5pts (+2.5%) on a year ago to 102.4 and Community Services marginally in
positive territory at 100.4 and up 0.5pts (+0.5%) on a year ago. The pressure that high
inflation and rising interest rates are placing on consumer spending habits
is clear when one considers the Retail industry has the lowest Business
Confidence of all at only 54.5, and down by 38.3pts (-41.3%) from a year ago
heading into the most important retailing period of the year. The
latest ARA-Roy Morgan pre-Christmas forecasts
predict total pre-Christmas retail sales of $78.4 billion (up 0.8% on a year
ago) (seasonally
adjusted figure of $67.1 billion). Two other industries have
experienced large falls in Business Confidence over the last year including
the important primary export industries of Agriculture, down 32.5pts (-32.2%)
from a year ago to only 68.5 and the Mining industry, down 33.6pts (-27.9%)
from a year ago to 87.0. Business
Confidence for Top 5 and Bottom 5 Industries in September – October 2023
Source: Roy Morgan Business Single Source,
September-October 2023, n=3,303. Base:
Australian businesses. Business
Confidence increased 3.3pts to 90.4 in October as businesses grew
increasingly confident about their own performance over the next year:
Michele
Levine, CEO of Roy Morgan, says Business Confidence increased marginally in
October, up 3.3pts to 90.4 – before the RBA raised interest rates to 4.35%
last week: “Roy
Morgan Business Confidence was up 3.3pts to 90.4 in October. However, despite
the monthly increase, the measure has now spent a record nine straight months
(since February 2023) in negative territory below 100. “The
increase in Business Confidence in October was driven by greater confidence
from businesses about their financial situation. Now 40.1% of businesses (up
1.8ppts on a month ago) say they expect to be ‘better off’ financially this
time next year and just 32.3% (up 1ppt) said they are ‘better off’
financially than a year ago. “However,
an increasing majority of businesses, now 51.9%, say that now is a ‘bad time
to invest in growing the business’ – the highest figure for this indicator
for over a decade since May 2012. In contrast, only 39.8% of businesses say
now is a ‘good time to invest in growing the business.’ “The
RBA’s decision to increase interest rates in November, up 0.25% to 4.35%, was
the first increase under new RBA Governor Michele Bullock and came after
higher-than-expected ABS
annual inflation figures for the year to September 2023 – 5.6%, up
0.4% points from August 2023 (5.2%). “The
increase to interest rates in November adds to the likelihood that interest
rates will increase again in December, or early in 2024, as inflation
pressures in the economy persist. A big driver of the up-tick in the
inflation figures is the record high petrol prices. Average retail petrol
prices in Australia have now averaged over $2 per litre for over three months
– since mid-August. “On
a State-by-State basis Business Confidence is once again clearly highest in
Western Australia at 120.3 in line with the year-long average of 120.4.
Western Australia has been the most confident State for most of the year and
that trend has continued in the last few months. “Business
Confidence is below the neutral level of 100 in all other States but higher
than the national average in Tasmania (95.7), Queensland (92.5) and NSW
(91.6). The measure is now lowest of all in SA at only 51.0 following a
massive fall of 41.7pts (-44.9%) from a year ago. “At
an industry level it is Administration & Support Services which is the
most confident industry in September-October with a Business Confidence
rating of 127.2 – the most confident the industry has been for over two
years. “In
second place is Education & Training on 120.6 which has been the most
consistently confident industry so far this year – averaging a sky-high
Business Confidence of 123.1 during the first ten months of the year – more
than 10pts higher than any other industry so far in 2023. “Also
performing well are Electricity, gas & water on 118.2, Information Media
& Telecommunications on 113.5, Public Administration & Defence on
111.3, Manufacturing on 102.4, Finance & Insurance on 100.9 and Community
Services on 100.4. “The
challenging conditions for the retail industry are well known and with high
inflation and rising interest rates, which are now at their highest level for
12 years, the industry has clearly the lowest Business Confidence at only
54.5 – dropping by more than 40% from a year ago. “The
latest ARA-Roy
Morgan pre-Christmas retail sales forecasts released last week show
expected spending of $78.4 billion ($67.1 billion seasonally adjusted) in the
run-up to Christmas. This represents an increase of only 0.8% on a year ago –
well below the current level of annual inflation reported by the ABS which is
currently estimated at around 5.5%.” (Roy Morgan) 14 November, 2023 Source: https://www.roymorgan.com/findings/roy-morgan-business-confidence-october-2023
817-821-43-30/Polls ANZ-Roy Morgan Consumer
Confidence Plunges 3.5pts To 74.3 – After The RBA Raises Interest Rates To 12-Year
High Of 4.35%
ANZ-Roy Morgan Consumer Confidence dropped 3.5pts to
74.3 this week after the RBA raised interest rates by 0.25% to 4.3% - the
highest official interest rates have been in 12 years. Consumer
Confidence is now at its lowest since mid-July 2023 and has spent a record 41
straight weeks below the mark of 85. Consumer Confidence is now 6.5pts below
the same week a year ago, November 7-13, 2022 (80.8) and is now clearly below
the 2023 weekly average of 78.0. Looking around the States
Consumer Confidence was down in NSW, Victoria, Queensland and South
Australia, but up slightly against the trend in Western Australia –
essentially a reverse of last week. Driving this week’s
decrease was a deterioration in people’s buying intentions after the interest
rate rise and growing concerns about the long-term health of the Australian
economy. Current
financial conditions
Future
financial conditions
Current
economic conditions
Future
economic conditions
Time
to buy a major household item
ANZ
Senior Economist, Adelaide Timbrell, commented: The
ANZ-Roy Morgan Australian Consumer Confidence index decreased last week to
its lowest level in four months following the cash rate hike to 4.35% by the
RBA. But confidence about future economic conditions – the outlook for the
economy over the next five years – fell to its lowest level since April 2020.
This suggests that the RBA hike may have been a negative economic signal for
some households. The fall in confidence was driven by those most exposed to
the rate hike, those paying off their homes and those who own their homes
outright (a cohort including many who have investor mortgage debt). Continued
elevated inflation is also keeping confidence low across all cohorts.
(Roy Morgan) 14 November, 2023 Source: https://www.roymorgan.com/findings/9360-anz-roy-morgan-consumer-confidence-november-14 MULTICOUNTRY
STUDIES
817-821-43-31/Polls October
2023: Consumer Confidence Declines Sharply Across Southeast Asia, A 29
Country-Survey
Ipsos’
Global Consumer Confidence Index is down 0.4 point from last month to 47.2. This
marks the fifth consecutive month without a significant month-over-month
change for the index. Among 29 economies measured, just four show significant
gains in consumer sentiment while nine show a notable decline. The global Current and
Investment indices both show significant declines this month of more than
half a point. In contrast, the global
Expectations and Jobs’ indices show little change. Sentiment decreased
significantly in Southeast Asia this month. Malaysia
(-5.3 points) and Singapore (-4.0 points) show the largest declines among all
countries. Consumer confidence is also down in Indonesia (-3.0 points). Sentiment is also down
significantly in Europe, as the Netherlands
(-3.9 points), Sweden (-2.3 points) and France (-2.2 points) all show
significant declines. In contrast, consumer confidence is up in Latin America. Argentina
(+3.9 points), Colombia (+3.6 points) and Mexico (+3.4 points) all show
significant month-over-month gains of at least three points. The Global Consumer Confidence Index is the average
of all surveyed countries’ Overall or “National” indices. This month’s
installment is based on a monthly survey of more than 21,000 adults under the
age of 75 from 29 countries conducted on Ipsos’ Global Advisor online
platform. This survey was fielded between September 22 and October 6, 2023.
Consumer sentiment in 29
countries Among the 29 countries, India (64.1) now holds the highest National Index
score this month. This is the first time since eight new
countries were added in February that a country other than Indonesia has held
the highest score. For the third consecutive month, India and Indonesia
(62.9) remain the only countries with a National Index score of 60 or higher.
Just six other countries show a National Index above
the 50-point mark: Brazil (58.5), Mexico (58.5), Thailand (58.1), the U.S.
(52.0), Singapore (51.7), and the Netherlands (50.5). In contrast, just five countries show a National
Index below the 40-point mark: South Korea (39.2), Japan (38.1), Argentina
(37.0), Hungary (35.6), and Turkey (34.5). Of note, sentiment in Canada (45.6) is now at its
lowest point since December 2020. Compared to 12 months ago, Australia (-4.0) and
Canada (-2.5), are the only countries to show a significant drop in consumer
sentiment. Eleven countries now show significant increases, most of all in
Belgium (+9.7) and Mexico (+9.3).
Trends Ipsos’ Global Consumer
Confidence Index (based on all 29 countries
surveyed) currently reads at 47.2, showing
stability (-0.4 point) for the fifth consecutive month. Based only on the
“legacy 20 countries” tracked since March 2010, it would read at 45.2.
The Current sub-index, reflecting
consumers’ perceptions of the economic climate and
their current purchasing, jobs, and investment confidence, shows a decline across the 29
countries of 0.7 point to 37.1. Just six countries show a significant
month-over-month gain (at least 2 points) in their Current index, while ten
countries also show a significant loss. The Investment sub-index, indicative
of consumers’ perception of the investment climate, is down 0.6 point and sits at 39.3.
Only four countries show a significant gain in their Investment index, while
nine countries show significant losses. The Expectations
sub-index, indicative of consumer expectations
about future economic conditions, shows
little change this month (-0.2) and is now at 56.4. Six
countries show significant gains in their Expectations index, and six
countries show significant losses. The Jobs sub-index, reflecting
perceptions about jobs security and the jobs market, is down an insignificant 0.2 point this
month and now sits at 57.4. In total, six countries show significant gains in
their Jobs index, and five countries show significant losses. Of note, Singapore, the Netherlands
and Sweden show significant declines (of at least 2 points) across all four
sub-indices. In contrast, Argentina and Colombia all show significant
month-over-month gains across all four sub-indices.
(Ipsos Global) 19 October, 2023 Source: https://www.ipsos.com/en/october-2023-consumer-confidence-declines-sharply-across-southeast-asia 817-821-43-32/Polls Survey
Across 142 Countries Tells Almost A Quarter Of The World Feels Lonely
Nearly one in four people worldwide -- which
translates into more than a billion people -- feel very or fairly lonely,
according to a recent Meta-Gallup survey of more than 140 countries. Notably, these numbers could be even higher. The
survey represents approximately 77% of the world’s adults because it was not
asked in the second-most populous country in the world, China.
With the World Health Organization and many others
-- including the U.S. surgeon general -- calling attention to the dangers of
loneliness, these data, collected in partnership between Gallup and Meta,
provide a much-needed global perspective of social wellbeing. The Global
State of Social Connections report, which launches Nov. 1,
2023, will detail these and other country-level findings based on the first
global study of loneliness, which entails nationally representative surveys
conducted in 142 countries and areas worldwide. Older Adults Report Lowest
Levels of Loneliness Global results indicate that the
lowest rates of feeling lonely are reported among older adults (aged 65 and
older), with 17% feeling very or fairly lonely, while the highest rates of
feeling lonely are reported among young adults (aged 19 to 29), with 27%
feeling very or fairly lonely. Although many calls to reduce loneliness are focused
on older adults, majorities of those aged 45 and older do not feel lonely at
all, while less than half of those younger than 45 say the same.
Globally, Men and Women
Are Equally Lonely In general, rates of reported
loneliness are similar between men and women. Global results show that 24% of
both men and women report feeling very or fairly lonely. In most countries, there is little to no gender
difference in rates of feeling lonely, but substantial gender gaps do exist
in some places. Overall, there are more countries in which the rate of
self-reported loneliness is higher for women than for men (79 countries) than
the opposite pattern (63 countries).
Half the World Isn’t
Lonely Not everyone is lonely. Forty-nine
percent of people surveyed reported that they are not lonely at all, which
translates into approximately 2.2 billion people across the 142 countries
surveyed in this research. Bottom Line In countries all over the world,
millions of people experience loneliness in their daily lives. Research shows
that loneliness is associated with elevated risk for a wide range of physical
and mental health conditions, making research on loneliness a critical first
step to improving health and wellbeing worldwide. Overall, these global data show that a quarter of
people report feeling very or fairly lonely, with older adults the least
likely to report feelings of loneliness. Understanding differences in how
people experience -- or do not experience -- loneliness across the globe can
lead to new avenues for mitigating loneliness and improving social wellbeing
in communities everywhere. The forthcoming report on the Global State of Social Connections explores
how feelings of loneliness differ across countries and shares corresponding
data on rates of social connectedness, which are considerably higher
(globally) than the data on loneliness may seem to suggest. (Gallup) 24 October, 2023 Source: https://news.gallup.com/opinion/gallup/512618/almost-quarter-world-feels-lonely.aspx 817-821-43-33/Polls Most
Countries Don’t Observe Daylight Saving Time, A Survey Across 193 Nations
Most Europeans will adjust their clocks on Oct. 29
to “fall back” an hour, and most Americans will do the same on Nov. 5. But
Europe and the United States are more the exception than the rule. Most
countries do not observe daylight saving time – the practice of advancing and
winding back clocks seasonally in the spring and fall. How we did this Here are seven facts about daylight saving time and
time zones around the world: Only about a third of the
world’s countries practice daylight saving time, and the vast majority of
them are in Europe. Within Europe – as defined by the
United Nations – only Armenia, Azerbaijan, Belarus, Georgia,
Iceland, Russia and Turkey do not practice daylight saving time. Outside of Europe, daylight saving
time is most common in North America – where parts of the U.S. and Canada use
it – as well as Latin America and the Caribbean. Egypt stands out as the only African nation with
daylight saving time. About half of all
countries in the world observed daylight saving time in the past but no
longer do so. In the last decade alone, Azerbaijan, Iran, Jordan, Namibia, Russia, Samoa, Syria, Turkey and Uruguay have
all ended their seasonal time changes. In 2022, the
Mexican congress also voted to abolish summer time in most of the
country, though large Mexican cities near the U.S. border and a few other
places are exempted. Egypt has the unique distinction of
having ended daylight saving within the last decade (2014) and bringing it back. This year,
the country again adjusted its clocks in an effort
to save energy. While most of Europe and the U.S. practice daylight
saving time, some policymakers in the European
Commission and in the U.S.
Congress have proposed doing away with it. Some countries, including
the U.S., have daylight saving time in only part of the country. In
the U.S., Hawaii and most of Arizona, as well as some territories, do not
observe daylight saving time. Australia, Brazil and Canada are similar.
For example, in
Australia, daylight saving is not observed in Queensland, the Northern
Territory, Western Australia, Christmas Island or the Cocos (Keeling)
Islands. Some countries have
changed their time zones in the past decade for political or economic
reasons. For example, President Nicolás Maduro
in Venezuela decided in 2016 to reverse
his predecessor’s time zone change – which was intended to allow
children to wake up for school in the daylight – because of concerns about
electricity consumption. In 2018, North Korean leader Kim
Jong Un changed
his country’s clocks to match those of South Korea in advance of a
historic summit – reversing his 2015 decision to establish his own time zone,
Pyongyang time. São Tomé and Príncipe
changed its time zone twice – once in 2018 as part of
a strategic development plan and again in 2019 under a new prime minister,
restoring the previous time zone. Since 2018, Morocco has also
permanently been on daylight saving time (essentially switching its time zone
from UTC+0 to UTC+1), changing
its clocks based on Ramadan rather than for summer and winter time. The U.S. is one of the few
countries with multiple time zones. Only around
20 countries in the world have more than one time zone – often because they
administer overseas territories. France, for example, is often
cited as the country with the most time zones – 12 or 13, depending
on the time of year. But everyone living in metropolitan
France – the part of France located in Europe – resides within a
single time zone. Russia has
the most contiguous time
zones, with 11. The U.S., for its part, has nine time zones, with
six of them covering the 50 states and the remaining three applying to
territories. And some
U.S. states even have more than one time zone within them. The vast majority of
countries are “on the hour,” but a few are not. In
most of the world, entering a new time zone means you only need to adjust the
hour hand on your watch. But visiting a few countries requires you to adjust
the minute hand, too. Afghanistan (UTC+4.5), India
(UTC+5.5), Iran (UTC+3.5), Myanmar (UTC+6.5) and Sri Lanka (UTC+5.5) are all
on the half hour, while Nepal (UTC+5.75) is on
the 45-minute mark relative to most other time zones. (UTC is Universal Time Coordinated or
Coordinated Universal Time and was called Greenwich Mean Time, or GMT, prior
to 1972.) Also, Australia and Canada each
have some places that are on the hour and some that are on the half hour.
In New
Zealand, most of the country is on the hour, but the Chatham Islands are
on the 45-minute mark. If you want to schedule a
meeting that’s convenient for the most people on Earth, consider using the UTC+8
time zone. Around a fifth of the world’s
population lives in this time zone, which includes all of China. UTC+8 also
includes all or part of other populous countries such as the Philippines,
Indonesia and Australia, among other places. Another good option for your
meeting would be UTC+5.5, the time zone that includes India – the
world’s most populous nation – along with Sri Lanka. This time zone
is home to about 18% of the world’s population. (PEW) 26 October, 2023 Source: https://www.pewresearch.org/short-reads/2023/10/26/most-countries-dont-observe-daylight-saving-time/ 817-821-43-34/Polls Israel
/ Gaza Conflict: 7 In 10 Britons Concerned About Plight Of Civilians On Both
Sides, A Study In US And UK
New polling from Ipsos, conducted October 20-23rd,
explores public attitudes to the current conflict in Israel and Gaza amongst
British adults. This includes, how closely the public are following the
conflict, how much they claim to know about the historic reasons for it, what
role they would like the UK government to play and who they hold responsible
for the conflict itself. Background and knowledge
of conflict
Strong public concern for
civilians (and other potential consequences)
What role should the UK
government play?
Comparing the views of the
British and US public When we compare results to a similar (but not
identical) poll by Ipsos in the US for Reuters, we note some differences in
the views of the British and American public. The US public is much more
likely to want their government to support Israel and much less likely to
want them to support Palestinians than the British public. Though it should
be stressed that these polls were conducted at different times and answer
choices presented were not identical – with British respondents offered don’t
know and prefer not to say options. However, these findings do lend some
insight into the differing public perspectives in each country. What involvement should
the UK / United States have in the current conflict in Israel and Gaza, if
any?
* Options not available to
US respondents Who do the British public
blame most for the conflict?
Keiran Pedley, Director of
Politics at Ipsos, says of the findings: These
findings show strong levels of public concern about the current conflict in
Israel and Gaza amongst the British public. They are most concerned about the
plight of Israeli and Palestinian civilians but they are also worried about
security and community relations in Britain too. (PEW) 27 October, 2023 817-821-43-35/Polls People
Across 29 Countries Are Worrying That Artificial Intelligence Is Making It
Easier To Trick People
Telling fact from fiction is harder than ever. In the Age of AI, it’s pretty easy to get duped by a
deepfake video or text written by ChatGPT. Artificial intelligence has made telling what’s real
from what’s AI-generated difficult and many are feeling
nervous about the nascent technology and how it will be used by humans. AI aside, adults around the world are already pretty
skeptical of a range of companies, professions and institutions these days. “People do not trust politicians and the media that
much to begin with,” says Shunichi Uchida, CEO of Ipsos Japan. Indeed, the new edition of Ipsos’ Global Trustworthiness Monitor finds an abysmal 14%,
on average across 31 countries, think politicians generally are trustworthy
and just 25% think journalists are trustworthy. Whether the increasing use of emerging tech will
send trust levels even lower in the years ahead remains to be seen. What we’ve seen already is when seismic events
happen, from former U.S. President Donald Trump claiming the 2020
presidential election was stolen to the invasion of Ukraine in 2022 to the
Israel-Hamas war this month, misinformation and deepfakes spread like
wildfire online. Below, we look at how people across 29 countries are
feeling about fake news, lying and misinformation in these tense times. On the other hand, two in three are sure they can
discern facts from fictions.
Planting the seed that mainstream
news outlets were purposefully and constantly lying likely helped the
ex-reality TV star win the presidency in 2016.
America’s neighbors to the North
are anxious AI will make a bad situation worse.
While people in some countries are
significantly more worried than others about whether AI will make
misinformation worse, a strong majority (ranging from 64% in Germany to 89%
in Indonesia) globally agree AI is making it easier to generate very realistic
fake news stories and images.
There’s a constant stream of
information flowing across all of our smartphone screens all day, every day.
On the other hand, two in three are
sure they can discern facts from fictions. (Ipsos Global) 31 October, 2023 Source: https://www.ipsos.com/en/data-dive-fake-news-age-ai 817-821-43-36/Polls Comparing
Views Of The U.S. And China In 24 Countries
In recent years, views
of the United States and China have changed a lot. This year, the
U.S. is largely viewed positively in the 24 countries we surveyed.
At the same time, China
is seen much more negatively – especially in high-income countries.
But favorability does not tell the whole story. Both countries are seen
positively in some ways and negatively in others. Based on surveys conducted in 24 countries, we
examine how the U.S. and China stack up to one another on more than 10
different measures, spanning from confidence in their leaders to views of
their universities and technological achievements. We focus on the difference in how people see the
two superpowers. Take one aspect of foreign policy as an example. In
Greece, 93% say the U.S. interferes in the affairs of other countries,
compared with 56% who say the same for China, for a difference of 37
percentage points. The Greek flag is therefore plotted farther to the left,
closer to the U.S. end of the scale, at 37. Australians, though, see little difference between
the superpowers and consider both the U.S. (79%) and China (77%) to be
interventionist powers. The Australian flag is therefore plotted at 2, close
to the midpoint, which represents no difference in ratings of the two
countries on this measure. Across all 24 countries surveyed, we see that while
majorities in most countries see both the U.S. and China as prone to
interfering in the affairs of other countries, the U.S. is almost always more
likely to be described this way. All of the flags are thus generally to the
left of the midpoint and closer to the U.S. end. These metrics can be viewed
for each country by hovering over that country’s flag. Ratings of whether the U.S. and China take each
country’s interests into account paints a somewhat different picture. Most
flags are still to the left of the midpoint – and closer to the U.S. end –
because more people across countries say the U.S. accounts for their
country’s interests than China. But the flags are more spread out across the
scale because publics feel quite differently from one another about this. We can also see differences between middle- and
high-income countries.1 Selecting middle-income countries on the
bottom right of the graphic shows that middle-income countries are mostly
clustered together around the midpoint of the scale and that they evaluate
the U.S. and China similarly. Conversely, selecting high-income countries shows that
they are clustered together on the left, giving higher ratings to the U.S.
than China when it comes to accounting for other countries’ interests. The U.S. also gets higher marks for contributing to
global peace and stability than China does, and the differences in
evaluations are often 30 points or more. The difference is greatest in Japan,
where 79% say the U.S. contributes at least a fair amount to international
stability and just 14% say the same of China – a difference of 65 points.
While still large in many countries, differences are smaller in many
middle-income countries. And in Indonesia and Hungary, U.S. and Chinese
contributions to global peace and stability are seen in a similar light. For more on international views of the U.S., read “International
Views of Biden and U.S. Largely Positive,” and for more on international
views of China, read “China’s
Approach to Foreign Policy Gets Largely Negative Reviews in 24-Country Survey.” Favorable views of the
U.S. and China On balance, views of the U.S. are much more positive
than views of China, and increasingly
so. Opinion skews toward the U.S. most heavily in the
high-income countries surveyed, with differences of 50 percentage points or
more in favor of the U.S. in Poland, Japan and South Korea. In all three
countries, more than seven-in-ten offer positive ratings of the U.S., and
fewer than three-in-ten have favorable opinions of China. In most middle-income countries surveyed, views of
both powers are generally positive, leading to a smaller difference in views.
Nigeria is the lone public surveyed with warmer opinions of China than of the
U.S., though both the U.S. and China receive positive ratings from large
majorities of Nigerians. Hungary – notably the
only country where positive ratings of the U.S. are the minority opinion
– and Kenya stand out for having near equal shares of adults who rate the
U.S. and China favorably. Just under half offer positive ratings of each
superpower in Hungary, and roughly seven-in-ten Kenyans see the U.S. and
China favorably. Is favorability of the
U.S. and China zero-sum? An alternate way to think about favorability is to
look at whether individuals in
a given country hold positive views of one superpower and not the other –
essentially a “zero-sum” mindset. In nine countries, this seems to be the case: A
majority or plurality has favorable views of the U.S. but not China. In both Japan and
Poland, 63% of adults have a favorable view of the U.S. and an unfavorable
view of China. Particularly in middle-income countries, though,
pluralities of a third or more have favorable views of both world powers. This includes
majorities in both Nigeria and Kenya. No more than a fifth of adults in any
country surveyed have a favorable opinion of China and an unfavorable opinion
of the U.S.
Leading economic power The U.S. economy is larger than China’s but has
tended to grow less per year, at
least until recently. Still, the U.S. is considered
by most surveyed publics to be the world’s leading economic power. And,
in many countries, this sense is growing. In Sweden, for example, 51% now say
that the U.S. is the leading economy, compared with 39% in 2020, when they
were more likely to give the title to China. South Koreans are especially likely to see the U.S.
as the world’s top economy, with 83% giving the title to the U.S. compared
with just 8% to China. Sizable differences of around 40 percentage points in
favor of the U.S. are also seen in Japan, Poland, Israel and India. Still, five countries – most of which are in Europe
– see China as the leading economy. This includes Italy, which is the only
country where a majority considers China the world’s leading economy.
Investment from the U.S.
and China In 12 countries, people were asked if American and
Chinese investment have benefited their economies.2 In Australia, Indonesia, Kenya and South Africa,
similar shares see investments from both superpowers as having helped their
country’s economy at least a fair amount. Conversely, Argentines are equally
likely to see Chinese and U.S. investment as having not benefited their country’s
economy. For those in Israel, Poland, India, Brazil and
Mexico, U.S. investment is seen as more beneficial. Only in Hungary and Nigeria is Chinese investment
seen more favorably than U.S. investment. Even then, 74% of Nigerians say
investment from the U.S. has benefited their country at least a fair amount. Ratings of American and
Chinese technology The U.S. and China are both widely seen as
technological powerhouses. For example, together they dominate
the global digital market. Between Google’s Android and Apple’s iOS,
American companies have
the vast majority of the mobile operating system market share worldwide.
Yet China leads the
charge toward 5G and global network coverage. Across the 24 countries surveyed, a median of 72%
describe U.S. technology as the best or above average and 69% say the same of
Chinese technology. And evaluations of the two superpowers’ technological
prowess differ little in seven countries. For example, 83% of Spaniards say
American technology is above average or the best, compared with 82% who say
the same for China. Seven publics give U.S. technology more positive
ratings. Among them, Israelis and South Koreans stand out for their favorable
evaluations of American technology relative to Chinese technology; this is
driven by Israelis’ high ratings of American technology and South Koreans’
low ratings of Chinese technology. China’s technology is seen more positively in 10
countries, including in the U.S. Technological achievements are the only
measure where Americans see China outpacing the U.S. About two-thirds of
American adults (66%) say China’s technology is above average or the best,
compared with 56% who say the same about their own country. There is little distinction between middle- and
high-income countries’ ratings of either country’s technology, but some
regional patterns do emerge. China’s technological achievements are rated
more positively in the Latin American countries surveyed, while the Asian
countries included give the U.S. more positive marks. Quality of American and
Chinese technology products
Respondents in 12 countries further evaluated
technology from the U.S. and China on their quality and other attributes. Roughly three-quarters or more in each country
surveyed say American products are well-made, including 94% in Nigeria and
92% in Israel. China’s technology gets
more variable ratings, with 82% in Nigeria saying it’s well-made compared
with just 36% in Israel. Israel is the lone country to have a majority say
China’s technological products are poorly made. Respondents were also asked about the price of
technology products from either country. A 12-country median of 77% call
American products expensive, while 42% say the same of Chinese products. With regards to data security, views are mixed. On
balance, people are more likely to say technology produced by American
companies protects personal data than to say the same of Chinese companies. Still, the shares who say American technology
protects personal data range from 81% in Nigeria to 25% in Hungary. China’s
technology garners similarly varied opinion, with 78% in Nigeria saying it
protects users’ personal data but just 15% of Australians saying the same. Earlier this year, as TikTok faced a
potential ban in the U.S., most Americans were similarly
distrusting when asked about data privacy and the behavior of
Chinese social media companies. Ratings of American and
Chinese militaries The U.S. and China are home to two of the world’s
largest militaries. China’s active forces are nearly
double the size of the United States’, though the
U.S. outspends China on defense. Majorities in every country surveyed say the
American military is above average or the best, while the same is only true
for China in about half of the countries surveyed. In most countries surveyed, the U.S. military
receives significantly higher ratings than China’s. There are three
exceptions: In Germany, the Netherlands and the United Kingdom, all NATO allies of
the U.S., the United States’ and China’s militaries are about equally likely
to be considered above average or the best. However, the U.S. military gets
more recognition than China’s when considering only those who say each
is the best. Israelis stand out for their near unanimous positive
ratings of the U.S. forces. While a majority of Israelis rate China’s
military highly, the 39-point gap in ratings is the largest of any country
surveyed. Unlike other measures of hard and soft power, there
is little difference in ratings of the American and Chinese militaries
between middle- and high-income countries. American and Chinese
entertainment In 2020, China replaced the U.S. as the world’s
largest film market after a number of successful local productions,
and its government released
a five-year improvement plan for its film industry a year
later. Most of the top
10 highest grossing films globally were nonetheless still American
productions in 2022. Global views of entertainment from each country
parallel these trends. U.S. entertainment – including its music, movies and
television – is more than four times more likely to be seen as the best or
above average than China’s (a 24-country median of 71% vs. 17%,
respectively). High-income countries view American entertainment
more favorably than middle-income countries. Entertainment ratings skew
toward the U.S. most heavily in Israel, where adults are 71 percentage points
more likely to call American entertainment, rather than Chinese, above
average or the best. Differences greater than 60 points in favor of the U.S.
are also seen among the Dutch, Italians, Poles and Swedes. The sub-Saharan African publics surveyed offer the
highest praise for Chinese entertainment, especially in Nigeria, where 67%
say it is the best or above average. Even so, each public gives U.S.
entertainment higher ratings. American and Chinese
universities In May 2023, Chinese President Xi Jinping announced
plans for bolstering
China’s education system to spread its global influence and create a
“‘Study in China’ brand.” Currently, out of the
top 100 universities in the world, as rated by the Times Higher
Education, only seven are in China, whereas 34 are in the U.S. This disparity is reflected in views of the two
countries’ universities. Across the 24 countries surveyed, a median of 68%
say U.S. universities are above average or the best, while just 35% say the
same of China’s. Universities in the U.S. receive significantly more
positive ratings than universities in China in all countries surveyed.
Middle-income countries give both countries’ universities some of the most
favorable evaluations, but the gap in the ratings of the two are similar to
the gaps seen in high-income countries. Europe is home to some of the largest differences as
well as the smallest. Poles, Greeks and Hungarians are at least 40 points
more likely to say American universities are above average or the best than
Chinese universities. The differences are much smaller – in large part due to
less positive outlooks on American universities – in the Netherlands, Germany
and the UK. Notably, the U.S. has one of the least positive
perceptions of American universities, along with several other advanced
economies. About half in each saying American universities are the best or
above average. American and Chinese
standards of living As of 2021, both the U.S. and China fall above the
world average on the United
Nations’ Human Development Index, but the U.S. is considered a very high human development country
while China is labeled a high human development country. The difference is
reflected in international ratings of the two countries’ standards of living.
Though ratings of both vary greatly, greater shares say the standard of
living in the U.S. is above average or the best in every country surveyed. Israelis and Poles stand out for holding
particularly skewed views of each country’s standard of living, in favor of
the U.S. In Israel and Poland, roughly eight-in-ten regard the standard of
living in the U.S. in high regard, while 9% and 19% say the same of China,
respectively. In several high-income countries, ratings of the
standard of living are low for both the U.S. and China. For example, just 16%
of Germans see the standard of living in the U.S. as above average or the
best and 8% say the same of China. In comparison, middle-income countries
offer some of the most positive evaluations of the standards of living in the
two economic powerhouses. Respect for personal
freedoms The U.S. is generally considered by experts to be
more democratic than China. Among other organizations, Freedom House describes
the U.S. as “free” and China as “not free,” and International
IDEA labels the U.S. a “democracy” versus China’s “authoritarian
regime.” Public opinion follows the same pattern. In a survey
of 17 high-income publics in 2021, the
U.S. government was far more likely than the
Chinese government to be seen as respecting its people’s personal
freedoms, and previous
surveys of both high- and middle-income countries have recorded
similar findings. The U.S. government was seen as more respectful of its
people’s personal freedoms than China’s even as it received increasingly
negative ratings between 2013 and 2018. In 2021, the differences between ratings of the
United States’ and China’s treatment of personal freedoms were especially
pronounced in South Korea and Taiwan. In both, roughly three-quarters said
the U.S. respects its people’s personal freedoms compared with only about
one-in-ten who said the same for China. Differences of about 50 percentage
points or more were also measured across most of Europe. Conversely,
Singapore stood out for having the smallest difference and being the most
likely to consider China respectful of its people’s personal freedoms. Confidence in the American
and Chinese presidents When it comes to leaders, global publics are nearly
three times more likely to have confidence in U.S. President Joe Biden than
in Chinese President Xi Jinping (medians across 23 countries, not including
the U.S., of 54% and 19%, respectively). Each country surveyed is more likely
to have confidence in Biden than Xi, but this has not always been the case
for ratings of the U.S. president. The gap in confidence ratings of the U.S. president
and the Chinese president has shifted
greatly in the last 10 years with each American leader. Views of the
two leaders were most similar in several countries when former President
Donald Trump held office. Views of Biden and Xi differ across high- and
middle-income countries. Those in middle-income countries are more likely to
rate Biden and Xi similarly. For example, 71% of Nigerians have confidence in
Biden, while 62% say the same of Xi – a 9-point difference. In high-income countries, the gap tends to be much
larger – especially in parts of Europe, including Poland and Sweden. In many places, though, respondents are less likely
to offer an opinion on Xi than Biden. For example, in Hungary, 24% of
respondents said they did not know the answer or declined to answer when
asked about their confidence in Xi, while only 6% responded similarly when
asked about Biden. (PEW) 06 November, 2023 Source: https://www.pewresearch.org/global/2023/11/06/comparing-views-of-the-us-and-china-in-24-countries/ |
|||||||||||||||||||||||||||


