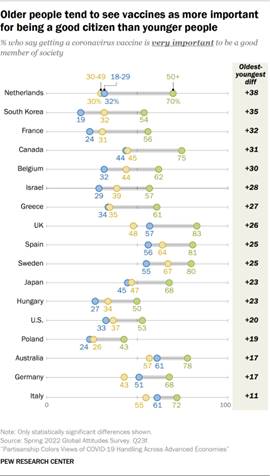
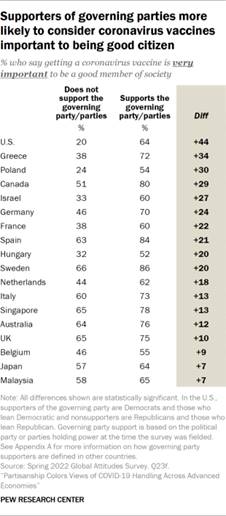
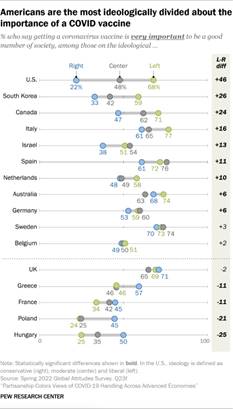
|
BUSINESS &
POLITICS IN THE WORLD GLOBAL OPINION REPORT NO. 755 Week:
August 08 – August 14, 2022 Presentation:
August 19, 2022
Commentary:
Workers Disagree With Their Bosses Over How Productive They Are Working From
Home Ugandans’
Economic Outlook Continues To Worsen Kenyans
Skeptical About Honesty Of Elections Just
3 In 10 Britons Say They Would Report Neighbors Breaking A Hosepipe Ban Public
Do Not Believe The Government’s Approach To Tackling The Harms Inflicted By
Drugs Is Working Rishi
Sunak Losing ‘Electability’ Advantage Over Liz Truss According To Public Workers
Disagree With Their Bosses Over How Productive They Are Working From Home Half
Of Germans (51 Percent) See Climate Change As The Greatest Challenge For
Today's Youth Energy
Supply Is Currently The Most Important Issue For Germans Two-Thirds
Of Germans In Favour Of Suspending The Debt Brake Only
5% Of Irish Adults Believe That The Economy Will Improve In The Coming Six
Months Nearly
Half Of Younger Adults Say They Wish There Were More Parties To Choose From Most
Americans Who Have Faced Extreme Weather See A Link To Climate Change –
Republicans Included Average
American Remains Ok With Higher Taxes On Rich As
Gun Violence Remains A Major Concern, Americans Favor Stricter Regulations Partisanship
Colors Views Of Covid-19 Handling Across 19 Advanced Economies A
Median Of 70% Of Adults Across 19 Countries Say They Will Be Worse Off Than
Their Parents INTRODUCTORY
NOTE
755-43-24/Commentary:
Workers
Disagree With Their Bosses Over How Productive They Are Working From Home
The
argument against home working has long been that without their ever-watchful
bosses, workers will do less at home than they would in their usual
workplace. Indeed, before the Conservative leadership contest, Jacob Rees
Mogg was leading the charge to boost civil service productivity by getting
workers back to the office. However, new YouGov research among workers and
business decision-makers reveals disagreement between the two groups about how
productive one can be away from the office. British
workers who worked at home during the most recent period where the government
recommended home working say they are more productive in the homestead (60%).
Around a quarter say their location makes little difference, and 17% confess
they are less productive in the home office compared to the workplace.
Their
bosses, however, are not so sure. When it comes to their team, these decision
makers are split - 33% think their direct reports are more productive working
from home, while 35% think they get less done. Thinking about their company
as a whole, only 25% say they think home working is more productive, compared
to 38% who say the workplace produces better results. In both cases, around a
quarter think it makes no difference to productivity whether employees are in
the workplace or at home. Despite
their greater suspicions about their workers, when it comes to rating their
own performance, only 28% of business decision-makers say they themselves get
more done in the workplace than at home. Two in five (44%) say they are more
productive at home, while a further 26% say there is no difference whether
they’re at the workplace or at home. (YouGov
UK) 755-43-25/Country Profile:
SUMMARY
OF POLLS
ASIA (Pakistan) Between 2004-2006 And 2018-2019 Periods, There Has Been A
2% Rise In The Proportion Of Households Reporting To Own A Car Data from PSLM reveals that
between 2004-2006 and 2018-2019 periods, there has been a 2% rise in the
proportion of households reporting to own a car A nationally representative
sample of adult men and women from across the country was asked the following
question regarding,” Do you have a car? In response to this question, between
2004-2005 the car ownership was reported to be at 4%, which later increased
up to 6% between 2018-2019. (Gallup Pakistan) August 11, 2022 AFRICA (Uganda) Ugandans’ Economic Outlook
Continues To Worsen The cost of living in Uganda is
on the rise as prices for essential commodities such as food, cooking oil,
and soap have increased sharply, largely due to surging fuel prices
(Observer, 2022). As of July 2022, annual inflation was reported at 7.9%, up
from 2.9% at the beginning of the year. Many businesses are struggling to
survive, and the value of the shilling against the U.S. dollar is dropping
(Trading Economics, 2022; Monitor, 2022a). Some experts and prominent
government figures, including President Yoweri Museveni, have largely
attributed the economic meltdown to the Russian invasion of the Ukraine
(Independent, 2022). (Afrobarometer) 8 August 2022 (Kenya) Kenyans Skeptical About Honesty
Of Elections A peaceful transition of power
after Kenya's election on Tuesday may say more about the country's future --
and the future of stability in the region -- than whom voters ultimately
choose as their next president. Both candidates will need to overcome
skepticism about the electoral process that has been brewing since 2019.
Overall, 35% of Kenyans had confidence in the honesty of elections in 2021,
including just a quarter (26%) of those in the richest 20% of households. (Gallup) AUGUST 9, 2022 WEST EUROPE (UK) Just 3 In 10 Britons Say They Would Report Neighbors
Breaking A Hosepipe Ban As more parts of the
country are given hosepipe bans by their water providers, new research by
Ipsos shows three in ten Britons (31%) say they are likely to grass-up their
neighbours by informing local authorities or water providers if they spotted
a neighbour or someone in their local area breaking the ban. Around half
(49%) say they would be unlikely to do so. Britons are just as unlikely to
confront their neighbours personally, 30% say they are likely to confront
them in person, while half say they are unlikely to do so (51%). (Ipsos MORI) 8 August 2022 Public Do
Not Believe The Government’s Approach To Tackling The Harms Inflicted By
Drugs Is Working New YouGov data sheds some light
on Britain’s thoughts on how they believe the government should be tackling
substance abuse in the UK. Many Britons either have or have had an addiction
problem themselves (7%), or have a friend (10%) or family member (11%) with
an addiction problem. Two thirds of Britons (66%) believe the government
currently does too little to tackle addiction issues in the UK, with a
similar proportion believing that current policy does a bad job of minimising
the harm of drugs to people who use them (65%) and society (64%). (YouGov UK) August 11, 2022 Rishi Sunak
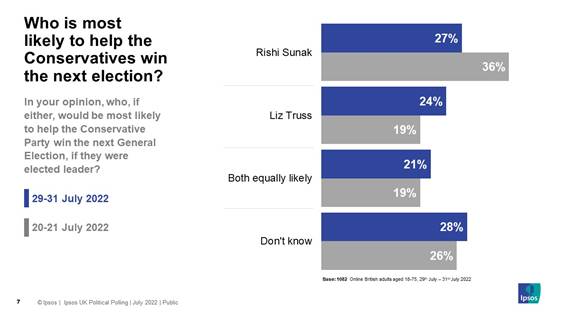
Losing ‘Electability’ Advantage Over Liz Truss According To Public Rishi Sunak has lost an advantage
he held with the public 10 days earlier on whether he or Liz Truss were most
likely to lead the Conservatives to a General Election victory. Now, 27%
think Sunak would be more likely to lead the Conservatives to win a General
Election, 24% say Liz Truss, whilst 21% think they would be equally likely
and 28% say they don’t know. Earlier in July, Sunak led by + 17 pts. A
similar pattern emerges when looking at 2019 Conservative voters. 32% of
those voting Conservative in 2019 think Rishi Sunak would be most likely to
lead the Conservatives to victory at the next General Election. (Ipsos MORI) 10 August 2022 Workers Disagree
With Their Bosses Over How Productive They Are Working From Home British workers who worked at
home during the most recent period where the government recommended home
working say they are more productive in the homestead (60%). Around a quarter
say their location makes little difference, and 17% confess they are less
productive in the home office compared to the workplace. Their bosses,
however, are not so sure. When it comes to their team, these decision makers
are split - 33% think their direct reports are more productive working from
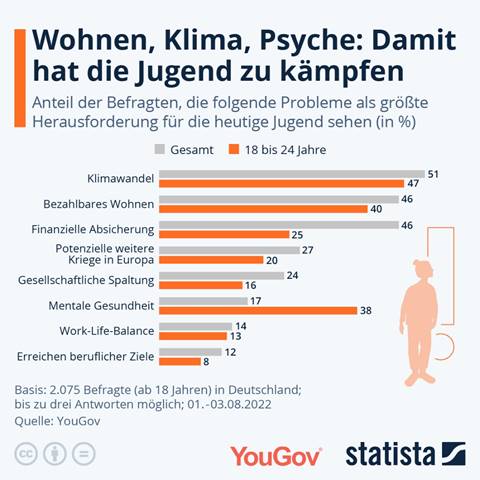
home, while 35% think they get less done. (YouGov UK) (Germany) Half Of Germans (51 Percent) See Climate Change As The
Greatest Challenge For Today's Youth Half of Germans (51 percent) see
climate change as the greatest challenge for today's youth. It is interesting
to note that respondents aged 55 and over are the most likely to make this
statement (60 percent). Among GenZ respondents, i.e. 18- to 24-year-olds, 47
percent say so. These are the results of a recent survey by YouGov in
cooperation with Statista. In each case, 46 percent of all Germans believe
that affordable housing and financial security in old age will be the
greatest challenges for young people. 27 percent say this about potential
further wars in Europe and 24 percent about the social division. (YouGov Germany) August 11, 2022 Energy Supply Is Currently The Most Important Issue For
Germans 27 percent of German citizens
entitled to vote say they will vote for the CDU/CSU if there were a federal
election next Sunday (28 percent in the previous month). The SPD would vote,
as in July 2022, 19 percent. The Greens come to 21 percent (20 percent in the
previous month). The values of the FDP fall slightly by 1 percentage point to
6 percent, those of the Left in turn rise by 1 percentage point and also land
at 6 percent. The AfD would vote for 14 percent of Germans in August 2022 if
there were a federal election next Sunday (12 percent in the previous month). (YouGov Germany) August 12, 2022 Two-Thirds Of Germans In Favour Of Suspending The Debt
Brake 36 percent of Germans are in
favor of an unconditional suspension of the debt brake. Three out of ten
respondents (29%) would only prefer a suspension if at the same time a
continued use of nuclear energy would take place beyond the planned nuclear
phase-out, which could enable further price reductions. Such an alternative
could represent an interesting compromise for the disunited traffic light
coalition on both the debt brake and the nuclear phase-out. (Ipsos Germany) 12 August 2022 (Ireland) Only 5% Of Irish Adults Believe That The Economy Will
Improve In The Coming Six Months Consumer outlook on the Irish
economy remains mired at an historic low-point in the third quarter of 2022.
Confidence briefly returned to a sense of optimism in January of this year,
following the removal of most COVID-19 restrictions. However, war in Ukraine,
and the threat of spiralling inflation and possible energy and food
shortages, plunged confidence back to a level only seen during the depths of the
financial crisis in 2009, and during the second COVID-19 lockdown in October
2020, with no recovery in confidence since then. Now, only 5% of Irish adults
believe that the economy will improve in the coming six months. (RED C) 2022.08.09 NORTH AMERICA (USA) Nearly Half Of Younger Adults Say They Wish There Were More
Parties To Choose From Partisan polarization has
long been a fact of political life in the United States. But increasingly,
Republicans and Democrats view not just the opposing party but also the people in that party in a negative
light. Perhaps the most striking change is the extent to which partisans view
those in the opposing party as immoral. In 2016, about half of Republicans
(47%) and slightly more than a third of Democrats (35%) said those in the
other party were a lot or somewhat more immoral than other Americans. Today,
72% of Republicans regard Democrats as more immoral, and 63% of Democrats say
the same about Republicans. (PEW) AUGUST 9, 2022 Just Over Half Of U S Public Schools Offer Mental Health
Assessments For Students; Fewer Offer Treatment Overall, just over half of U.S.
public schools (55%) provided students with diagnostic mental health
assessments to evaluate them for mental health disorders during the 2019-20
school year, according to the National Center for Education Statistics’
(NCES) School Survey on Crime and Safety. These assessments were conducted by a
licensed mental health professional employed or contracted by the schools. (PEW) Most Americans Who Have Faced Extreme Weather See A Link To
Climate Change – Republicans Included Overall, around four-in-ten
Americans say their local community has experienced severe weather like
floods and intense storms (43%) or long periods of unusually hot weather
(42%) in the past year, according to the May survey of 10,282 U.S. adults.
Smaller shares say their community has experienced droughts or water
shortages (31%), major wildfires (21%) or rising sea levels that erode
beaches and shorelines (16%). The survey was conducted before recent flooding that killed at least three dozen
people in Kentucky and before the outbreak of a major wildfire in California. (PEW) AUGUST 12, 2022 Average American Remains Ok With Higher Taxes On Rich Calls for higher taxes for those
at the top end of the income and wealth spectrum were a major part of
President Joe Biden's 2020 presidential campaign. The administration's
interest in raising taxes on the rich has continued since Biden took office,
including the recently proposed Billionaire Minimum Income Tax law that would
require the wealthiest American households to pay a minimum of 20% on all of
their income. Over six in 10 Americans are dissatisfied with the way income
and wealth are distributed in the U.S. Almost three-quarters worry about the issue, with 46% saying they worry a great deal. (Gallup) AUGUST 12, 2022 As Gun Violence Remains A Major Concern, Americans Favor
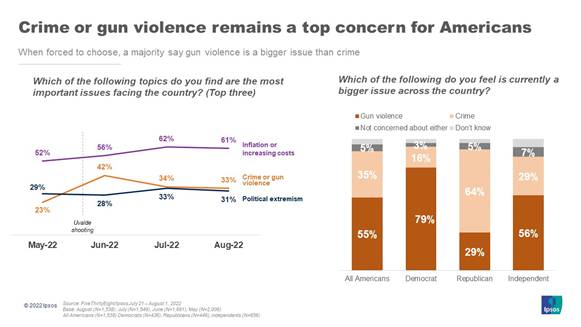
Stricter Regulations The latest FiveThirtyEight/Ipsos
Election Tracking poll finds crime or gun violence remains among Americans’
top concerns, albeit distantly behind inflation for most, and that a majority
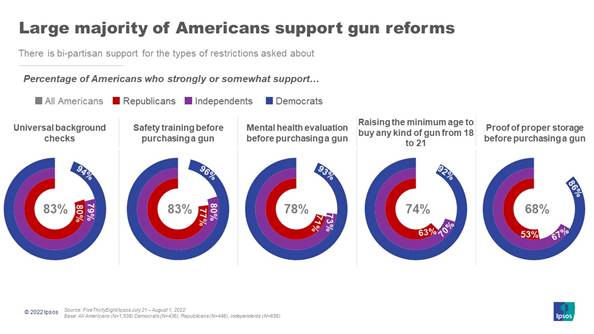
believe gun violence is a larger issue than crime. At the same time, just
over six in 10 Americans believe it is more important to control gun violence
than protect gun rights, and that the U.S. should have stricter restrictions
on gun ownership. In fact, a number of possible restrictions garner
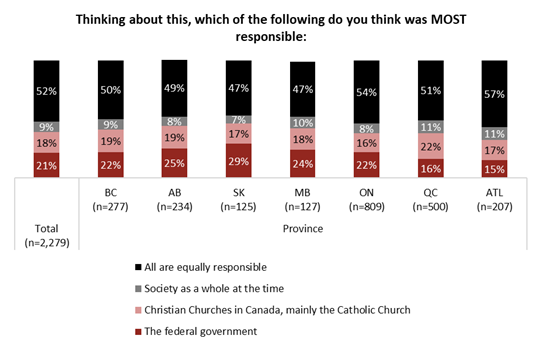
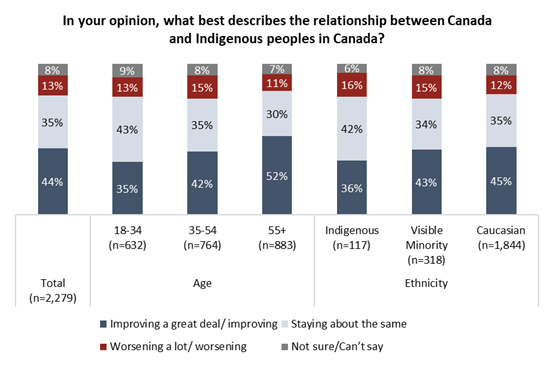
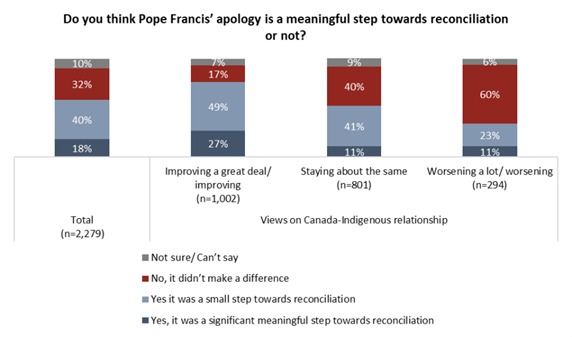
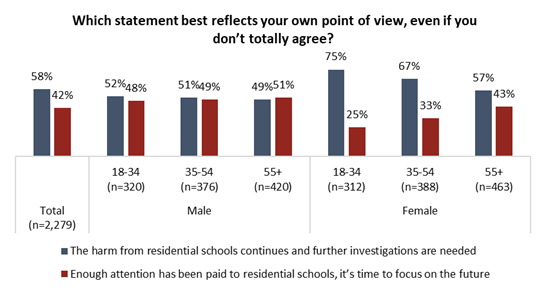
bipartisan support. (Ipsos USA) 10 August 2022 (Canada) Majority Of Canadians View Pope Francis’ Apology For
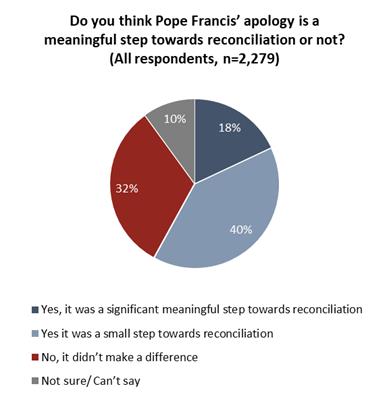
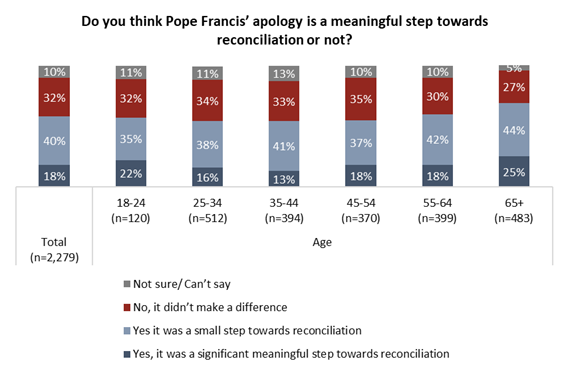
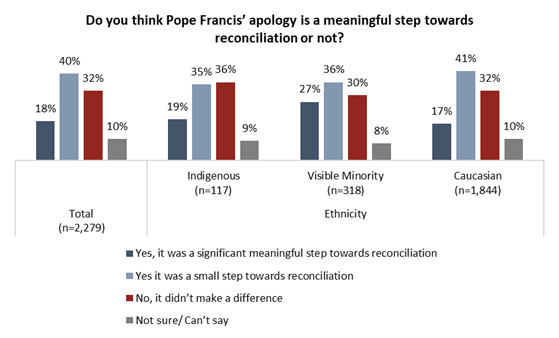
Residential Schools As A Step Towards Reconciliation Overall, three-in-five (59%) say
this, while one-in-three (32%) feel the apology does nothing to move
reconciliation forward. Respondents are twice as likely to view it was a
“small step” (40%) than a “significant” one (18%). Among a sample of
Indigenous respondents, opinions are similar but more muted, with 54 per cent
feeling this was a contribution to reconciliation, and 36 per cent feeling
the gesture offers no real practical impact. (Angus Reid Institute) August 11, 2022 AUSTRALIA The ALP In Victoria Increases Its Large Election-Winning
Lead From A Month Ago, ALP 60.5% cf L-NP 39.5% The result of the Roy Morgan Snap
SMS Poll represents an increase in support for the ALP of 3.2% points from
the 2018 Victorian State Election won by the ALP 57.3% cf. L-NP 42.7% and the
Government led by Premier Daniel Andrews is on track to increase its already
large majority in the Victorian Parliament. ALP two-party support in
Melbourne is 61.5% while 58.5% in the rest of Victoria. Although the ALP has
increased its two-party preferred result since early July, primary support
for both major parties is down. Support for the ALP is down 3% points to
40.5% while support for the L-NP was down by 2% points to 27.5%. Support for
the Greens increased, up 2% points to 14%. (Roy Morgan) August 14 2022 MULTICOUNTRY STUDIES Average Rate Of Inflation In FMCG Kantar Baskets Across All
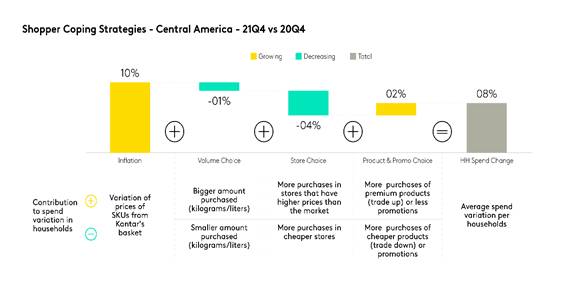
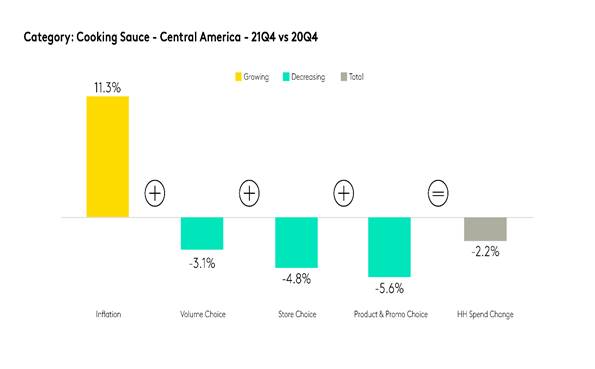
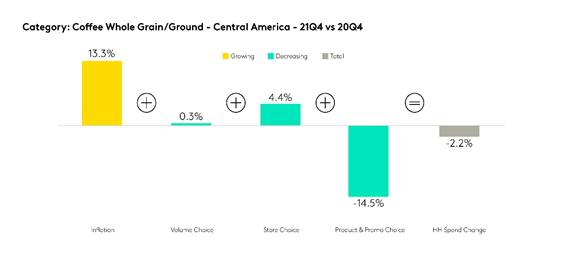
5 Latin American Countries Has Reached 10.4% Tackling inflation is a daily
challenge for Latin American consumers, and the mission to balance household
bills has required them to adapt their shopping behaviour. The average rate
of inflation in FMCG Kantar baskets across all Latin American countries has
reached 10.4% in Q4’21. The approach shoppers have taken to deal with that is
by reducing the average volume bought per household, and searching for the
store format that will offer them the most profitable relationship. At the
same time – and perhaps an unexpected reaction – they have replaced previous
product choices with higher value items, a way to preserve the investment. (Kantar) 10 August 2022 Source: https://www.kantar.com/inspiration/fmcg/how-do-latin-american-buyers-respond-to-financial-pressure 8% Of The World's Population Will Still Be Undernourished
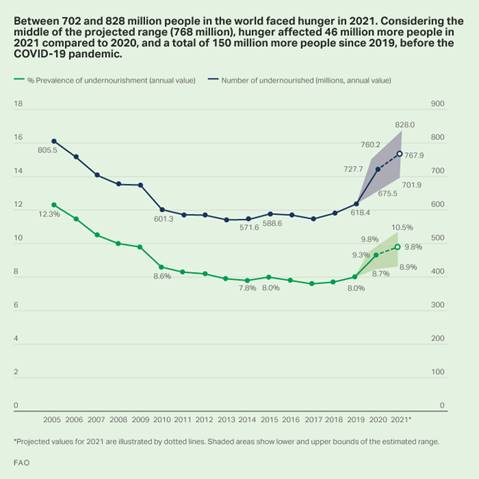
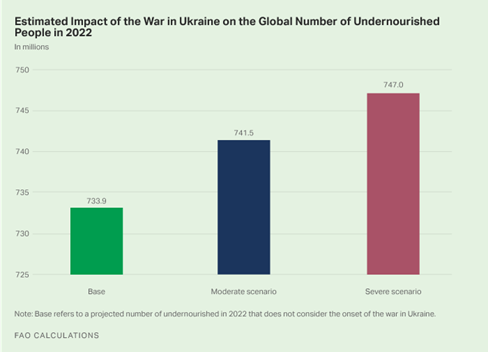
In 2030, A Worldwide Study By Food And Agriculture Organization Despite hopes that food security
-- which suffered major setbacks in 2020 -- would start to recover in 2021,
the latest State of
Food Security and Nutrition in the World report (SOFI) shows that 2021 brought
further setbacks. After remaining basically unchanged for five years, the
prevalence of undernourishment** -- the FAO's traditional indicator of the
extent of hunger -- increased from 8.0% to 9.3% between 2019 and 2020. It
kept rising in 2021, although at a slower pace than the year before, reaching
9.8%. (Gallup) AUGUST 10, 2022 Source: https://news.gallup.com/opinion/gallup/395984/world-hunger-severe-food-insecurity-grew-2021.aspx Partisanship Colors Views Of Covid-19 Handling Across 19
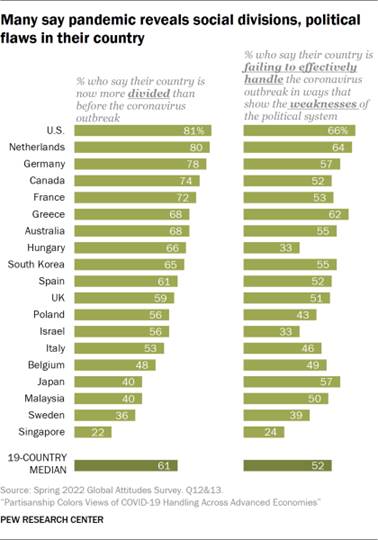
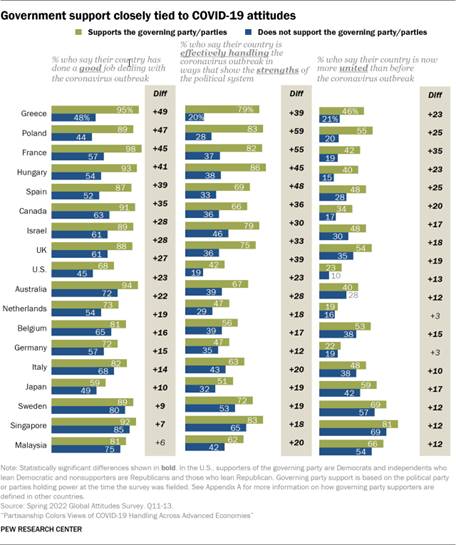
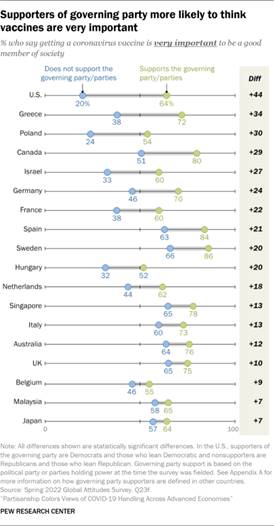
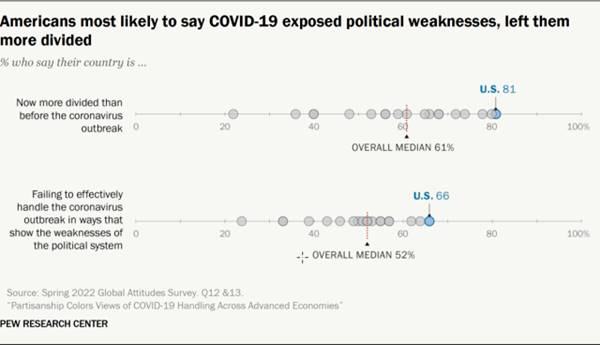
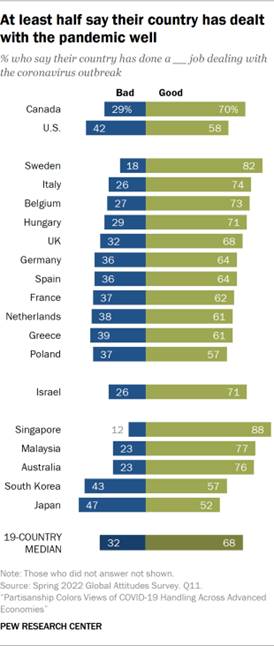
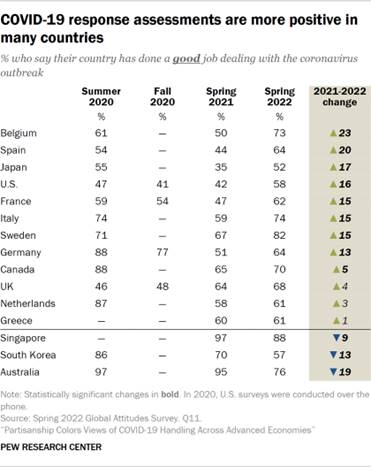
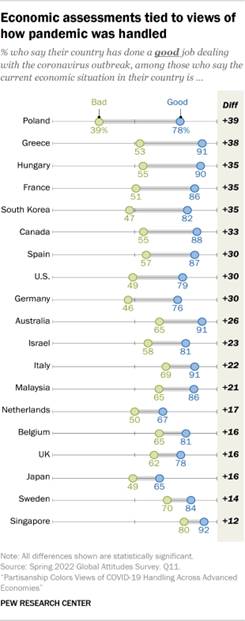
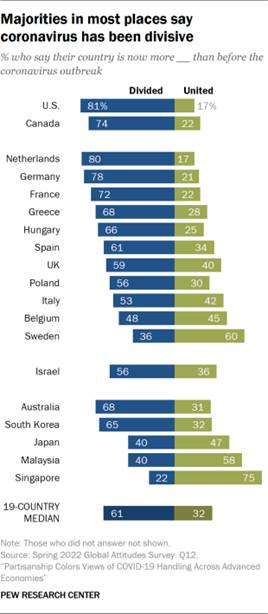
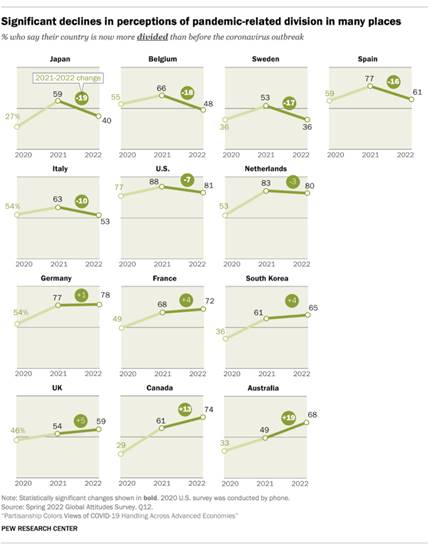
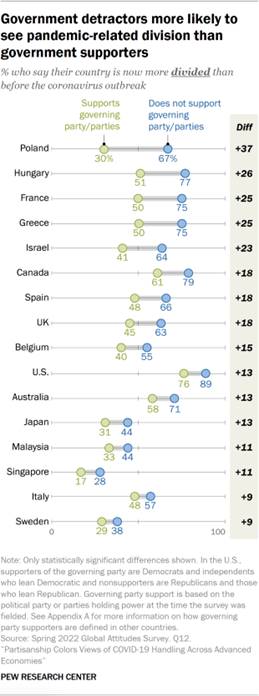
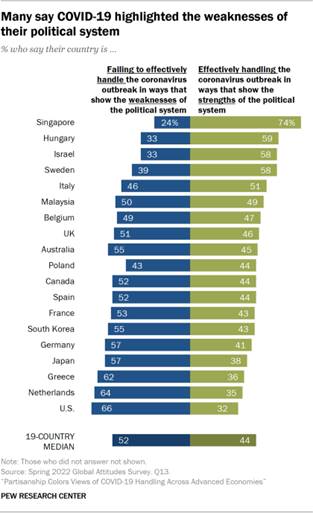
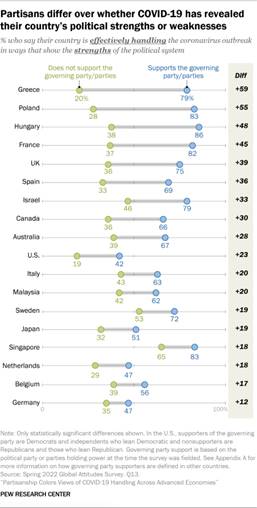
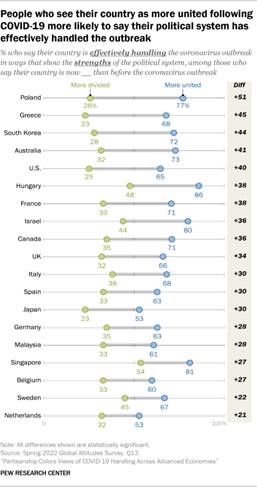
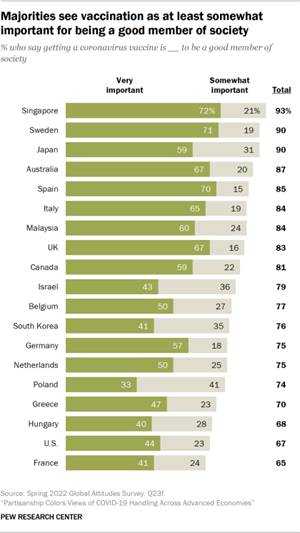
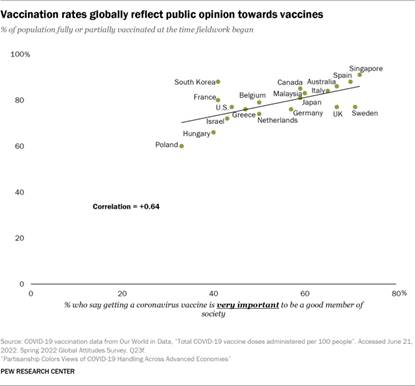
Advanced Economies Publics are increasingly
satisfied with the way their country is dealing with the COVID-19 pandemic,
according to a recent Pew Research Center survey in 19 countries. A median of
68% think their country has done a good job dealing with the coronavirus
outbreak, with majorities saying this in every country surveyed except Japan.
However, as the survey also highlights, most believe the pandemic has created
greater divisions in their societies and exposed weaknesses in their political
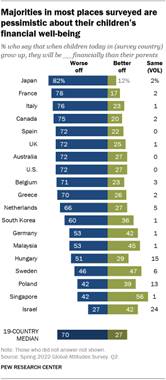
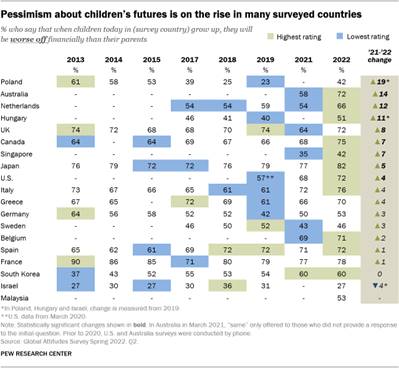
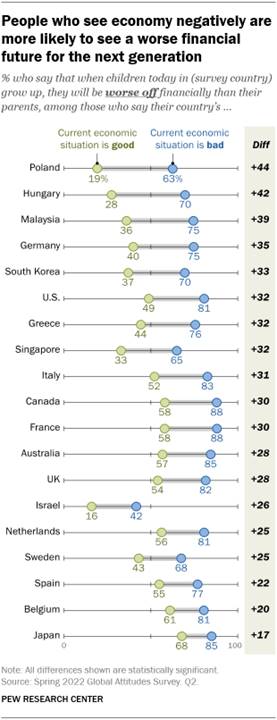
systems. (PEW) AUGUST 11, 2022 A Median Of 70% Of Adults Across 19 Countries Say They Will
Be Worse Off Than Their Parents When asked how children in their
country will fare financially when they grow up, a median of 70% of adults
across 19 countries say they will be worse off than their parents, according
to a Pew Research Center survey conducted this spring. At least
three-quarters of adults in Japan, France, Italy and Canada say children will
be worse off financially than their parents, as do majorities in Spain, the
United Kingdom, Australia, the United States, Belgium, Greece, the
Netherlands and South Korea. Singapore is the lone country surveyed where a
majority of adults (56%) believe the next generation will be better off financially. (PEW) AUGUST 11, 2022 Slightly More Than 2 In 3 (68%) People, On Average, Across
31 Countries Said They Were Concerned About The Impacts Of Climate Change It feels like the world’s on fire
(both literally and figuratively) these days. Heat waves have pummeled people
around the globe in 2022, from India and Pakistan this spring to the U.K.,
France and beyond this summer. There’s been wildfires and deaths linked to
the record-setting temperatures. Slightly more than 2 in 3 (68%) people, on
average, across 31 countries said they were concerned about the impacts of
climate change that were already being seen in their country in an online poll conducted this spring. (Ipsos MORI) 10 August 2022 Source: https://www.ipsos.com/en-uk/data-dive-how-people-feel-about-climate-change-and-what-do-about-it ASIA
755-43-01/Polls Between
2004-2006 And 2018-2019 Periods, There Has Been A 2% Rise In The Proportion
Of Households Reporting To Own A Car
This press release is part of a
special Gallup & Gilani Pakistan Data Analytics series that aims to
foster an empirical understanding of the ownership of household durables
scenario of Pakistan based on data generated by the PSLM survey. This Gallup Big
Data Analytics Report is based on a series of long-term surveys which measure
'Living Standards in Pakistan'. The current data was collected from 33.34
million scientifically selected households spread out in the rural and urban
areas of over 100 districts across Pakistan's 4 provinces and other
territorial units. The error margin is less than 2 percent at 95% confidence
level. PSLM (Pakistan Social and Living Standards Measurement) is a yearly
survey conducted by the Pakistan Bureau of Statistics to gather data from
provincial and district levels to assist the government of Pakistan. It
focuses on multiple social and economic factors. Gallup Pakistan Data
Analytics team has worked extensively on this data and this series of press
releases are our attempt to publicize the great efforts done by hundreds of
office bearers of the Bureau of Statistics who have traveled far and wide to
collect this data. This particular press release aims to assess the ‘Car
ownership’ scenario in Pakistan. Data from PSLM reveals that between
2004-2006 and 2018-2019 periods, there has been a 2% rise in the proportion
of households reporting to own a car A nationally representative sample of
adult men and women from across the country was asked the following question
regarding,” Do you have a car? In response to this question, between
2004-2005 the car ownership was reported to be at 4%, which later increased
up to 6% between 2018-2019.
Rural Urban Breakdown The car ownership was higher in
urban household (10%) compared to 3% in rural households between 2018-2019.
(Gallup Pakistan) August 11, 2022 Source: https://gallup.com.pk/wp/wp-content/uploads/2022/08/August-11.pdf AFRICA
755-43-02/Polls Ugandans’
Economic Outlook Continues To Worsen
After just beginning to recover
from the economic shocks of the COVID-19 pandemic, Uganda appears to be
sliding into another economic crisis. The cost of living is on the rise as
prices for essential commodities such as food, cooking oil, and soap have
increased sharply, largely due to surging fuel prices (Observer, 2022). As of
July 2022, annual inflation was reported at 7.9%, up from 2.9% at the
beginning of the year. Many businesses are struggling to survive, and the
value of the shilling against the U.S. dollar is dropping (Trading Economics,
2022; Monitor, 2022a). Some experts and prominent government figures,
including President Yoweri Museveni, have largely attributed the economic
meltdown to the Russian invasion of the Ukraine (Independent, 2022). The
opposition Forum for Democratic Change says the government is to blame for
the country’s dire economic situation (Monitor, 2022b). The COVID-19 pandemic
hit the economy hard starting in 2020, impacting businesses, revenue
collection, economic activity, and jobs. Recovery began in early 2022, when
all sectors were allowed to function at full capacity again. But inflation
presents a new threat to economic health and livelihoods. In response, the
government has urged citizens to tighten their belts. In a televised national
address, Museveni said that “government subsidies or removal of import taxes
would only cripple the economy” (Africa News, 2022), indicating that his
government would not intervene to ease the situation. Likewise, in a media
interview, the secretary of the treasury described "subsidies, price
controls, and tax cuts" as ineffective ways to address the current
economic shocks (Monitor, 2022c). How do ordinary Ugandans assess the situation?
According to the most recent Afrobarometer survey in Uganda, completed in
early 2022, citizens are growing increasingly discontent with the country’s
economic condition as well as their personal living conditions. A majority
think the country is headed in the wrong direction. Lived poverty has
increased, and fewer than half of citizens are optimistic about the near
future. Large majorities say the government is doing a poor job of managing
inflation and the economy in general, narrowing income gaps, creating jobs,
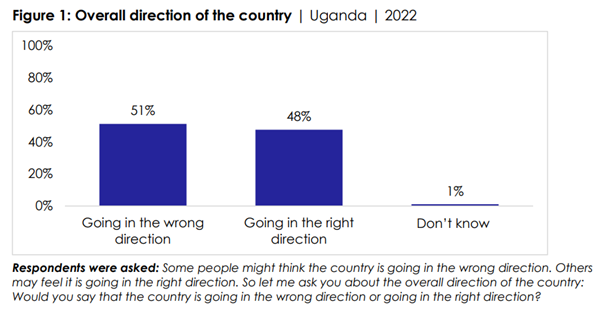
and improving living standards of the poor. Key findings Fewer than half (48%) of
Ugandans say the country is headed in “the right direction,” a 12-percentage-point decline
from 2019 (60%). Ugandans are
increasingly gloomy in their assessments of the country’s economic situation and their personal
living conditions: o Two-thirds (66%) describe the
country’s economic condition as “fairly bad” or “very bad,” a 20-percentage-point
increase from 2019. o Nearly six in 10 (58%) say
their personal living conditions are “fairly bad” or “very bad,” up 17 percentage points
from 2019. Seven in 10 Ugandans
(70%) experienced moderate or high levels of lived poverty during the previous year, a
10-percentage-point increase from 2017. Large majorities rate
government performance as “fairly bad” or “very bad” when it comes to keeping prices stable
(87%), narrowing gaps between rich and poor (84%), creating jobs (78%), improving
living standards of the poor (75%), and managing the economy (66%). Only 42% of Ugandans
expect economic conditions to improve over the coming year. Overall direction of the country Fewer than half (48%) of Ugandans
say the country is headed in “the right direction,” while a slim majority (51%) think the country
is going in “the wrong direction” (Figure 1).
The share of citizens who see the
country as headed in the right direction has declined by 12 percentage points since 2019,
wiping out gains recorded between 2017 and 2019 (Figure 2).
Worsening economic and personal
living conditions Two-thirds (66%) of Ugandans
describe the country’s economic condition as “fairly bad” or “very bad,” while only a quarter
(26%) consider the economic situation good. Similarly, nearly six in 10
Ugandans (58%) say their personal living conditions are “fairly bad” or “very
bad”; only 34% rate their living conditions favourably (Figure 3).
Negative assessments of the
country’s economic condition and personal living conditions have been growing
steadily since 2019 after declining between 2017 and 2019 (Figure 4). The
proportion of those who say the country’s economic condition is bad climbed
from 46% in 2019 to 58% in 2021, then increased by another 8 percentage
points in 2022. In parallel, the share of Ugandans who describe their
personal living conditions as bad increased by 10 percentage points between
2019 and 2021, then another 7 points over the past year.
Ugandans’ concerns about the
country’s economy and their own living conditions are reflected in their
experience of “lived poverty,” Afrobarometer’s experiential measure based on
how often people go without five basic necessities of life: enough to eat,
enough clean water, medicines or medical care, enough cooking fuel, and a
cash income (Mattes, 2020). More than nine in 10 citizens (93%) say they went
without a cash income at least once during the year preceding the survey,
including 54% who say this happened “many times” or “always” (Figure 5).
Nearly eight in 10 (78%) report going without medical care, including a
majority (57%) who say this occurred at least several times, while more than
half experienced shortages of food (62%), cooking fuel (57%), and clean water
(55%). An average of the responses to the questions on deprivation of
necessities is calculated to create Afrobarometer’s Lived Poverty Index,
whose scores range from 0 (no lived poverty) to 4 (high lived poverty). Seven
in 10 Ugandans (70%) experienced moderate (42%) or high (28%) lived poverty
during the past year, a 10-percentage-point increase from 2017 (60%) (Figure
6).
Negative assessments of the
country’s economic condition and personal living conditions increase sharply
with respondents’ level of lived poverty. The poorest are three times as
likely as the best-off to describe their living conditions as bad (69% vs.
23%), and almost twice as likely to see the economy as bad (75% vs. 42%),
suggesting that the economic crisis has disproportionately affected the poor
(Figure 7). Citizens in the Central Region (83%) are far more likely to
describe the economy as bad than residents of the Eastern (62%), Western
(61%), and Northern (56%) regions. Older citizens are more likely to report
poor living conditions than young respondents (63% of those aged 50 years and
above vs. 54% of those aged 18-30). Other differences by demographic group
are less pronounced, though men see their personal living conditions somewhat
more negatively than women (61% vs. 55%).
Government performance on
economic issues Amid rising prices for fuel and
basic commodities and increasingly negative assessments of economic and personal living
conditions, vast majorities of Ugandans think the government is doing a poor
job on key economic issues. Three-fourths or more of Ugandans say the
government is performing “fairly badly” or “very badly” on keeping prices
stable (87%), narrowing gaps between rich and poor (84%), creating jobs
(78%), and improving the living standards of the poor (75%). Overall,
two-thirds (66%) give the government a failing grade on managing the economy
(Figure 8).
Will the economic situation get
better? Assessing the evolution of the
country’s economic condition over the past 12 months, a period marked by the COVID-19
pandemic, almost two-thirds (62%) of Ugandans say things got “worse” or “much worse,”
while only 21% say they improved (Figure 9). And fewer than half (42%) are
optimistic that economic conditions will get better over the next 12 months, while 33% think
the situation will worsen. These projections are correlated
with respondents’ evaluations of government performance. In other words, citizens who are
pessimistic about the country’s future economic situation are also more likely to disapprove of
the government’s performance on key economic issues than their more optimistic
counterparts.
Conclusion Ugandans’ assessments of the
national economy and their personal living conditions are negative – and growing more so.
Even before the current crisis of rising prices, lived poverty was increasing, and fewer than
half of citizens expected things to improve in the near future. Overwhelmingly, Ugandans see
their government as failing on key economic issues. These findings challenge the
government to identify approaches that will prevent more families from falling into
poverty and enable the country’s battered economy to continue its recovery from the ravages of the
COVID-19 pandemic. (Afrobarometer) 8 August 2022
755-43-03/Polls Kenyans
Skeptical About Honesty Of Elections
A peaceful transition of power
after Kenya's election on Tuesday may say more about the country's future --
and the future of stability in the region -- than whom voters ultimately
choose as their next president. Ahead of what's expected to be a
close race between Deputy President William Ruto and longtime opposition
leader and former Prime Minister Raila Odinga, Gallup surveys show Kenyans
lack faith in the honesty of their elections -- which have been tainted by
irregularities and violence for decades. Quick Summary: The
two leading presidential candidates are offering Kenyans competing solutions
to the host of crises facing Kenya. Odinga, the erstwhile opponent of the
current president, has now secured his endorsement and hopes to win the
support of the electorate by promising monthly stipends of 6,000 Kenyan
shillings ($50 U.S.) to vulnerable households. He also hopes to implement a
new affordable healthcare system across the country. Ruto, in contrast, portrays
himself as a champion of the poorest Kenyans, having risen from poverty
selling chickens in his youth. A major part of Ruto's platform is focused on
supporting farmers by investing billions of dollars in agriculture, a sector
that employs more than 40% of Kenyans. Although Ruto has faced repeated
accusations of corruption throughout his political career, the candidate
dismisses these accusations as biased and has pledged to fight corruption if
elected. Trust in
Elections Continues to Decline: Both candidates will
need to overcome skepticism about the electoral process that has been brewing
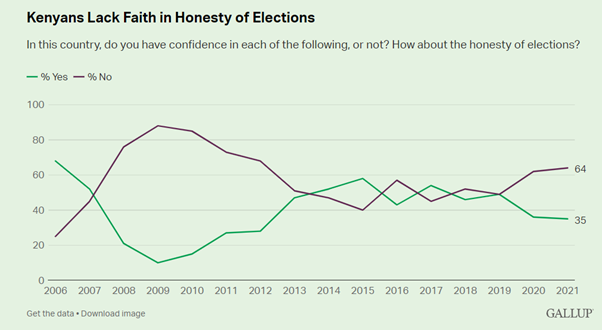
since 2019. Overall, 35% of Kenyans had confidence in the honesty of
elections in 2021, including just a quarter (26%) of those in the richest 20%
of households.
Still, Kenyans' relatively low
confidence today is much higher than it was in the aftermath of the hotly
contested election in 2007, when more than half a million Kenyans were
displaced from their homes and more than 1,000 were killed in widespread
violence. This crisis lasted until April 2008, when a power-sharing agreement
was established and Odinga was installed as prime minister. After Kenyans' confidence dropped
to an all-time low of 10% in 2009, it slowly started to recover, only to be
tested again in both the 2013 and 2017 elections, which were marred by
sporadic violence and irregularities. Allegations of misconduct in the 2017
election resulted in a rerun, in which incumbent President Uhuru Kenyatta was
again declared the winner. Kenyatta's running mate was Ruto. Most Kenyans,
Rich and Poor, Are Struggling to Afford Food: Apart
from electoral integrity and stability, the next president will need to deal
with economic headwinds bearing down on the country. The war in Ukraine has
limited grain and fertilizer supplies worldwide, with Africa in particular
bearing the brunt. This has been compounded by the worst drought in 40 years.
Crop output has declined by 70% in Kenya, further stressing diminishing food
reserves. Rising prices have added to food
insecurity woes, with annual inflation climbing to 8.3% in July. More than
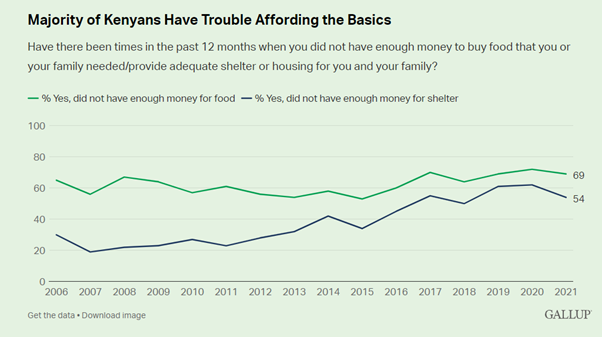
two-thirds of Kenyans, 69%, reported not having enough money for food in
2021, while more than half said they could not afford shelter.
While the poorest Kenyans
continue to struggle most with meeting their basic needs, Kenyans in all
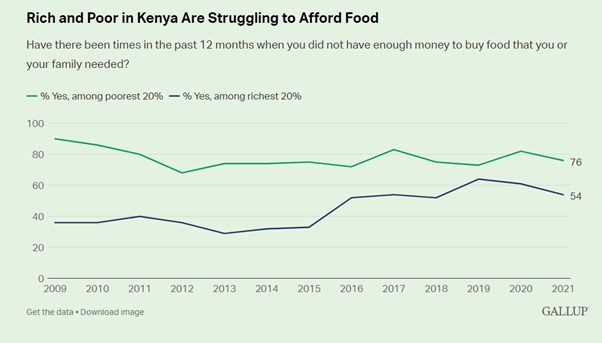
income brackets are feeling the pain. In 2021, majorities of Kenyans in the
poorest 20% of households (76%) and richest 20% of households (54%) said there
were times in the past year when they could not afford food they needed.
(Gallup) AUGUST 9, 2022 Source: https://news.gallup.com/poll/396131/kenyans-skeptical-honesty-elections.aspx WEST
EUROPE
755-43-04/Polls Just 3 In 10 Britons Say They Would Report Neighbors
Breaking A Hosepipe Ban
As more parts of the country are given hosepipe bans by their water
providers, new research by Ipsos shows three in ten Britons (31%) say they
are likely to grass-up their neighbours by informing local authorities or
water providers if they spotted a neighbour or someone in their local area
breaking the ban. Around half (49%) say they would be unlikely to do so. Britons are just as unlikely to confront their neighbours personally,
30% say they are likely to confront them in person, while half say they are unlikely
to do so (51%).
Most Britons who use a hosepipe in summer months when there is not a
ban (78% of the general public) say they would comply with any
potential ban. Six in 10 hosepipe users (58%) say they are unlikely to use
their hosepipe should their local area be given a ban, while around a third
(32%) say they are likely to do so. However, opinion is split when it comes
to expectations for others. Four in 10 (40%) believe most people in their
local area would be likely to use their hosepipe despite a ban, but the same
proportion (39%) expect them to comply with the ban. Considering any hosepipe ban itself, many believe watering home-grown
vegetables, fruits and herbs should not be included (60%), while just over a
third (36%) believe that this should be covered by a ban. Half (52%) say
watering plants, tree and shrubs in general should be included in any ban,
while three in four (73%) say the same for watering a lawn/using a
sprinkler. While using a hosepipe to wash your car (74%) or fences/patios/decking
(79%) should be included in any ban according to many Britons, the public
believes that washing or cooling down a pet should be allowed (61% say it
this not be covered by a ban while 31% disagree). Few believe filling a pool/paddling pool/hot tub is acceptable during
a hosepipe ban, as 73% say these activities should be included in any ban.
Similarly, 64% say people should not be allowed to fill a pond or water
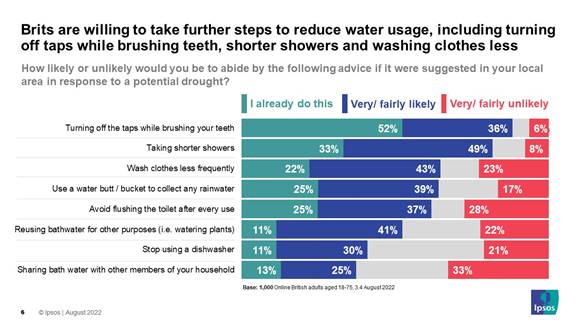
feature while a hosepipe ban is in place. Thinking about other advice which might be suggested in response to a
potential drought the majority say they already do or would be likely to turn
the tap off while brushing their teeth (52% already do this, 36% likely to
follow this advice if it was suggested), take shorter showers (33% already
do, 49% likely to if it was advised), wash clothes less frequently (22%,
43%), use a water butt to collect any rainwater (25%, 39%), and avoid
flushing the toilet after every use (25%, 37%). However, 1 in 5 or more
said they would be unlikely to follow potential advice to share bathwater
with other household members (33% unlikely), avoid flushing the toilet after
every use (28%), wash clothes less frequently (23%), reuse bathwater for
other purposes (22%) or stop using a dishwasher (21%).
Gideon Skinner, Head of Political
Research at Ipsos UK, said: Most British hosepipe users say
they themselves would follow a hosepipe ban, although they are less convinced
all their neighbours will do so – but still only a minority would inform on
rule breakers anyway. Britons also think that some activities should be
excused from any ban – specifically watering home grown produce and cooling
down pets, although using a hosepipe for washing, watering lawns and filling
paddling pools are definite no-nos. (Ipsos MORI) 8 August 2022 755-43-05/Polls Public Do Not Believe The Government’s Approach To
Tackling The Harms Inflicted By Drugs Is Working
Drug deaths
in England and Wales are at a
record high, while figures in Scotland are the worst
in Europe. In many parts of the world, drug policy is shifting, with some
states in the US moving to decriminalise certain
banned substances, and some European
nations adopting so-called ‘harm
reduction’ approaches to tackling the threat of substance abuse to
both individuals and society. Now, new
YouGov data sheds some light on Britain’s thoughts on how they believe the
government should be tackling substance abuse in the UK. The public do not believe the government’s approach to
tackling the harms inflicted by drugs is working Many Britons
either have or have had an addiction problem themselves (7%), or have a
friend (10%) or family member (11%) with an addiction problem. According to
the latest government
statistics 276,000 people in the UK sought help from state run
addiction services between April 2020 and March 2021. However, it
seems that many Britons don’t feel these services are up to scratch. The
public are highly critical of the current government’s approach to reducing
the impact of drugs upon society and people who use drugs. Two thirds of
Britons (66%) believe the government currently does too little to tackle
addiction issues in the UK, with a similar proportion believing that current
policy does a bad job of minimising the harm of drugs to people who use them
(65%) and society (64%). Labour
voters are especially critical, with 76% believing that the government does
not do enough to help tackle addiction issues in the UK, and 70% responding
that the government is doing a bad job of reducing drug-related harm to
society in general.
Britons are not in favour of criminalising people who use
drugs, and want to make drug consumption safer… The
government recently published a ten
year plan to tackle drug harms, however, unlike some other countries
around the world, the new plan continues to impose criminal penalties upon
people who use drugs. YouGov put the principle of ‘harm reduction’
approaches to Britons to see what they think of this alternative approach. Overall,
Britons disagree with the current approach of criminalising people who use
drugs. Asked whether people with addictions should be treated as criminals or
as mentally ill – as is the case in Portugal and some other countries – a
plurality of Britons (49%) say the latter. Only one in five (19%)
instead believe criminalisation is the right approach, with a further 19%
endorsing neither approach
In this
vein, to tackle soaring overdose and HIV rates amongst people who use drugs –
particularly those who inject them – some countries have opened supervised
drug consumption rooms. These are facilities where people who use drugs
are supervised while consuming drugs in case of overdose, and are also
provided with access to safe injecting equipment and sharps bins for safe
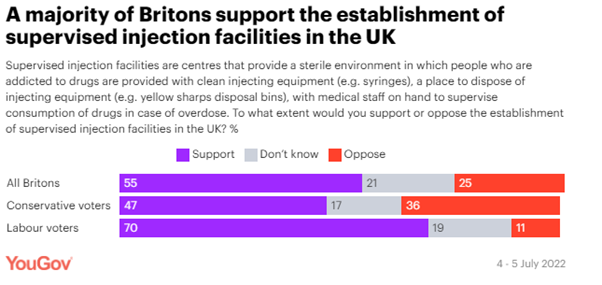
disposal. Britons are overall supportive of the government introducing such
facilities: a majority (55%) back their establishment, whilst only a quarter
oppose the idea (25%). Seven in ten Labour voters support the idea,
with Conservatives also tending to support by 47% to 36%.
…but relatively few support decriminalising drugs Another
major harm reduction initiative adopted in some European countries is the decriminalization
of drugs. Most notably, in an attempt to tackle their soaring overdose and
HIV rates, in 2001, Portugal opted to de-criminalise
all drugs. This in practice meant that drugs were not legalised, but that
those caught in possession of them were referred for treatment for addiction
and mental health issues in place of custodial sentencing or fines. Overall, few
Britons want to see drugs decriminalized, with a majority of Britons –
ranging from 53% through to 78% – opposing the decriminalization of the
individual banned substances we asked about. When it
comes to looking at support by each individual substance, support is clearly
highest for marijuana (45%), with the next highest support figure being for
‘magic mushrooms’ (28%). Despite the Labour party not
backing the decriminalization of marijuana, a majority of 2019
Labour voters would support the move (57%), compared to a third of
Conservative voters (33%). Support for
the decriminalization of ‘harder drugs’, such as heroin and cocaine however
is extremely low, at 11% and 15% respectively.
To
understand what motivates support for the continued criminalisation of
substances, we asked those who opposed the decriminalization of any named
substance what underlies their opposition. Analysis of these verbatim
responses unearthed several key themes. By far the
most popular reason was a belief that certain illegal substances pose more
harm to users than legal ones, with 30% responding with something to this
effect. ‘Because they’re banned for good reason’ ‘Because all the substances are very
harmful and should not be legal as part of a civilised society. This gives
the impression it is okay to use mind altering drugs when that is absolutely
not the case.’ ‘Certain substances can cause long term
mental and physical damage compared to other substances’ One in ten
(10%) felt that ‘all drugs are dangerous’, with some comments explicitly
mentioning alcohol and tobacco… ‘Because no drugs should be legal’ ‘Drugs should not be legal, there are no
good points to taking them’ ‘Alcohol and tobacco cause serious issues
already…’ Some were
also concerned about the impact of decriminalization on wider society (9%),
often containing references to the possible additional burden
decriminalization may have on society as a whole, including placing strain on
public services… ‘Because they are a drain on the public
purse in creating dependents who require treatment...’ ‘Because of the harm they do to the
users, society in general and to all those who are part of the supply chain.’ ‘Damage they do to the user and society
as a whole plus the cost to the NHS’ This concern
about the impact on wider society may have come from the sentiment that
decriminalization would normalise the use of drugs (5%) and lead to an
increase in use (8%), and the rate of addiction (8%), as well as the rate of
drug related crime (8%). ‘This would make them seem acceptable and
lead to more addicts…’ ‘Decriminalization may legitimise the use
of [drugs] in some people’s minds and encourage experimentation’ ‘Some lead to crime in order to fund
addiction.’
(YouGov UK) August 11,
2022 755-43-06/Polls Rishi Sunak Losing ‘Electability’ Advantage Over Liz
Truss According To Public
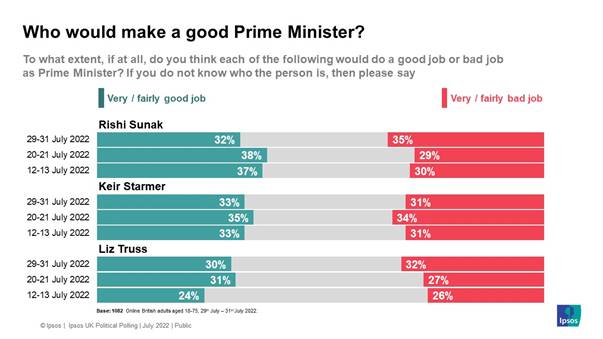
New research
by Ipsos, taken July 29th-31st, asked the public how closely they were
following the Conservative leadership contest, how much they knew about the
final two candidates, whether each would be a good or bad Prime Minister, who
would be most likely to win a General Election and how likely a government
led by either would deliver on a range of topics. Similar questions were
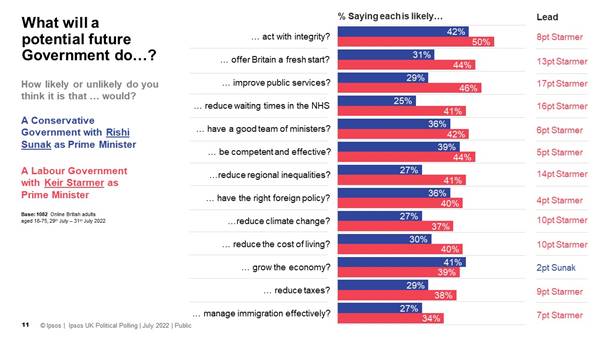
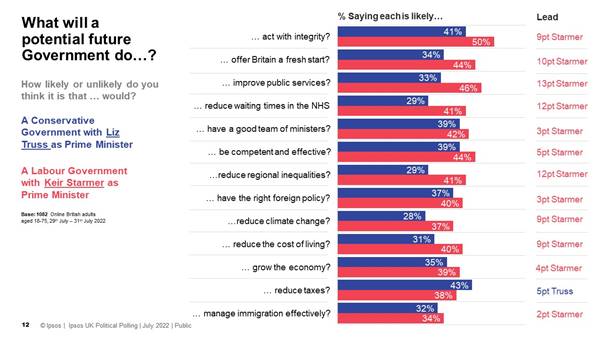
asked about Labour leader Keir Starmer too. Would Sunak or Truss be more likely to win a General
Election? Rishi Sunak
has lost an advantage he held with the public 10 days earlier on whether he
or Liz Truss were most likely to lead the Conservatives to a General Election
victory. Now, 27%
think Sunak would be more likely to lead the Conservatives to win a General
Election, 24% say Liz Truss, whilst 21% think they would be equally likely
and 28% say they don’t know. Earlier in July, Sunak led by + 17 pts.
Would Sunak, Truss and Starmer make a good or bad PM?
Sunak vs Starmer
Truss vs Starmer
How closely are the public following the contest?
Keiran Pedley, Director of Politics at Ipsos, said: Any public perception that the Conservatives would be more
likely to win a General Election under Rishi Sunak than Liz Truss appears to
have disappeared. However, whoever wins faces a significant challenge in
repairing the Conservative brand. The public are more likely to think a
Starmer-led Labour government would reduce the cost of living and improve
Britain’s public services – both key priorities for voters moving forward. (Ipsos MORI) 10 August
2022 755-43-07/Polls Workers Disagree With Their Bosses Over How
Productive They Are Working From Home
The argument
against home working has long been that without their ever-watchful bosses,
workers will do less at home than they would in their usual workplace.
Indeed, before the Conservative leadership contest, Jacob Rees Mogg was
leading the charge to boost civil service productivity by getting workers
back to the office. However, new YouGov research among workers and business
decision-makers reveals disagreement between the two groups about how
productive one can be away from the office. British workers
who worked at home during the most recent period where the government
recommended home working say they are more productive in the homestead (60%).
Around a quarter say their location makes little difference, and 17% confess
they are less productive in the home office compared to the workplace.
Their
bosses, however, are not so sure. When it comes to their team, these decision
makers are split - 33% think their direct reports are more productive working
from home, while 35% think they get less done. Thinking about their company
as a whole, only 25% say they think home working is more productive, compared
to 38% who say the workplace produces better results. In both cases, around a
quarter think it makes no difference to productivity whether employees are in
the workplace or at home. Despite
their greater suspicions about their workers, when it comes to rating their
own performance, only 28% of business decision-makers say they themselves get
more done in the workplace than at home. Two in five (44%) say they are more
productive at home, while a further 26% say there is no difference whether
they’re at the workplace or at home. (YouGov UK) 755-43-08/Polls Half Of Germans (51 Percent) See Climate Change As
The Greatest Challenge For Today's Youth
Tomorrow,
August 12, is International Youth Day. Youth is considered by many to be
exciting and eventful. Puberty, school education and graduation, friendships
and first love relationships characterize this phase of life. If one observes
the current and predicted economic situation and ecology for the future,
today's youth, unlike the youth a few decades ago, faces special challenges:
Half of Germans (51 percent) see climate change as the greatest challenge for
today's youth. It is interesting to note that respondents aged 55 and over
are the most likely to make this statement (60 percent). Among GenZ
respondents, i.e. 18- to 24-year-olds, 47 percent say so. These are the
results of a recent survey by YouGov in cooperation with Statista. In each
case, 46 percent of all Germans believe that affordable housing and financial
security in old age will be the greatest challenges for young people. 27
percent say this about potential further wars in Europe and 24 percent about
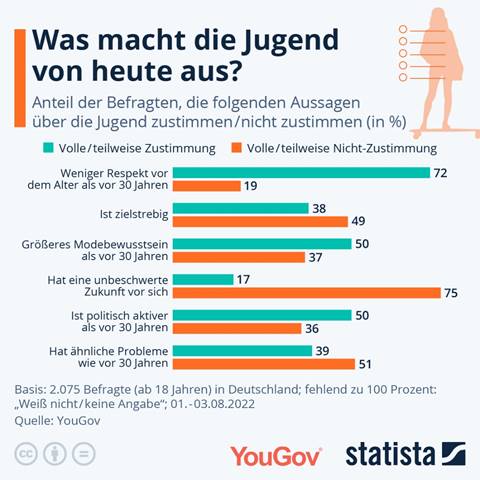
the social division. Today's youth is considered more disrespectful but also
politically active than previous generations But what
makes today's youth special in the eyes of Germans? 72 percent of respondents
think that today's young people show less respect for old age than they did
30 years ago. In turn, 50 percent of respondents in Germany say that today's
young people are more politically active than those of 30 years ago. Just as
many estimate that she is more fashion-conscious than the young people 30
years ago. However,
very few (17 percent) say that today's young people have a carefree future
ahead of them. Remembrance of the youth mostly positive 56 percent
of Germans associate something positive with their youth: 51 percent say they
have positive memories, another 5 percent say they are currently in their adolescent
phase of life and enjoy it. For 25 percent, however, association with their
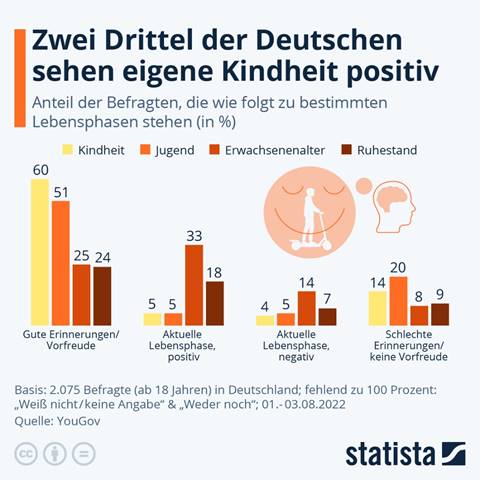
youth is negative. Even more
often, one's own childhood is seen as positive: 65 percent like their
childhood or have good memories of it. (YouGov
Germany) August 11,
2022 Source: https://yougov.de/news/2022/08/11/klima-wohnen-und-absicherung-im-alter-sind-grosste/ 755-43-09/Polls Energy Supply Is Currently The Most Important Issue
For Germans
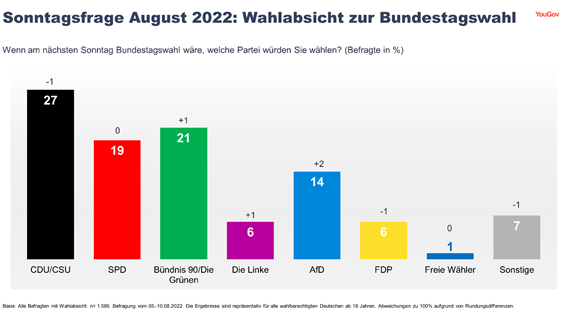
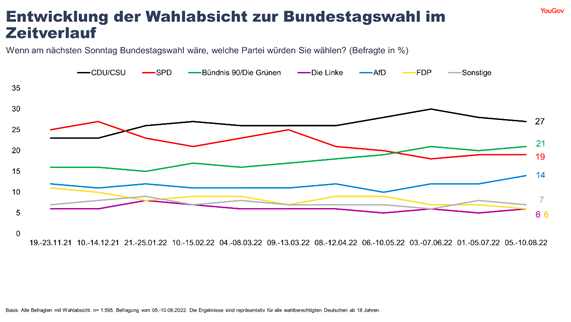
27 percent
of German citizens entitled to vote say they will vote for the CDU/CSU if
there were a federal election next Sunday (28 percent in the previous month).
The SPD would vote, as in July 2022, 19 percent. The Greens come to 21
percent (20 percent in the previous month). The values
of the FDP fall slightly by 1 percentage point to 6 percent, those of the
Left in turn rise by 1 percentage point and also land at 6 percent. The AfD
would vote for 14 percent of Germans in August 2022 if there were a federal
election next Sunday (12 percent in the previous month). This is the
result of the current YouGov Sunday question, for which 1,595 people among
2,039 eligible voters gave their voting intention between 05.08.2022 and
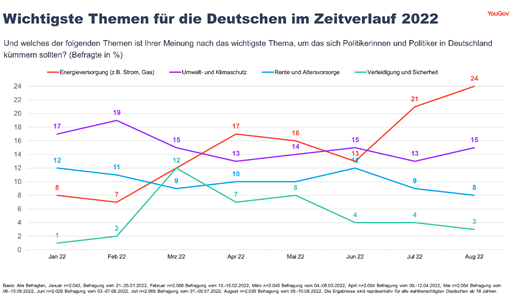
10.08.2022. Energy supply is currently the most important issue for
Germans In August
2022, almost one in four Germans (24 percent) says that energy supply is the
most important issue that politicians in Germany should take care of. This is
11 percentage points more than at the beginning of the summer: in June, 13
percent said so, in July already 21 percent. The values for energy supply as
the most important topic had risen significantly for the first time in March
2022, i.e. after the beginning of the war in Ukraine. Voters of the Union
currently make this statement most often (34 percent). For 15
percent of all respondents, environmental and climate protection is the most
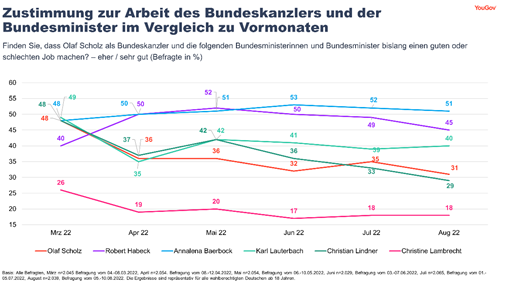
important issue. This is most often said by green voters (46 percent). Popularity of the Chancellor and some ministers is
declining In August
2022, 31 percent of German voters say chancellor Olaf Scholz of the SPD is
doing a good job. This is 4 percentage points less than in July (35 percent).
The figures for Federal Finance Minister Christian Lindner also fell by 4
percentage points to 29 percent (33 percent in the previous month). The same
can be observed in the values for Federal Minister of Economics Robert
Habeck: In August, 45 percent of Germans say that Habeck is doing a good job,
in July it was 49 percent. The approval
ratings of Foreign Minister Annalena Baerbock and Health Minister Karl
Lauterbach remain stable and are currently at 51 percent for Baerbock (52
percent in the previous month) and 40 percent for Lauterbach (39 percent in
the previous month). (YouGov
Germany) August 12,
2022 Source: https://yougov.de/news/2022/08/12/sonntagsfrage-energieversorgung-erneut-wichtigstes/ 755-43-10/Polls Two-Thirds Of Germans In Favour Of Suspending The
Debt Brake
This is
actually anchored in the Basic Law and largely prohibits the federal
government from incurring the state's debt. However, in times of crisis, it
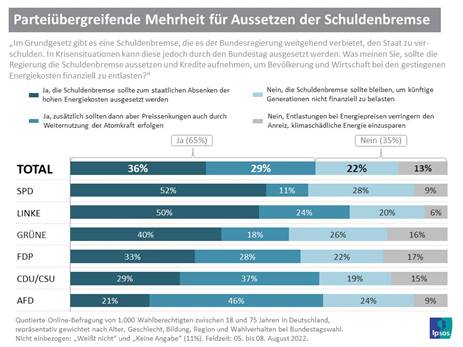
may be temporarily suspended. One in three in favour of compromise with the continued use
of nuclear power 36 percent
of Germans are in favor of an unconditional suspension of the debt brake.
Three out of ten respondents (29%) would only prefer a suspension if at the
same time a continued use of nuclear energy would take place beyond the
planned nuclear phase-out, which could enable further price reductions. Such
an alternative could represent an interesting compromise for the disunited
traffic light coalition on both the debt brake and the nuclear phase-out. Among those
respondents who want to continue to adhere to the debt brake, the proportion
of those who justify this decision above all with the principle of
intergenerational justice predominates. About one in five Germans (22%)
believes that a financial burden on future generations should be prevented at
all costs. Only 13 percent say that the debt brake should not be suspended
because a reduction in energy prices could reduce the incentive to save
climate-damaging energy. SPD and Left voters majority for debt brake exit Among the
supporters of the various parties, SPD (52%) and Left (50%) voters in
particular are in favour of the debt brake being unconditionally suspended.
Supporters of the CDU/CSU (29%) and AfD (21%) express the least support among
all parties for this statement. The option of suspending the debt brake in
combination with the continued use of nuclear power, on the other hand, is
preferred by almost half of AfD supporters (46%). And even among the
supporters of the Union, this proposal is well received by more than one in
three (37%). SPD (11%) and Green (18%) voters are least likely to agree with
this option. Adherence to the debt brake finds cross-party rejection Although
only a minority across party lines are in favour of sticking to the debt
brake in order to avoid financial burdens for future generations, it stands
out that this argument is somewhat more popular among supporters of the SPD
(28%) and Greens (26%) than among the supporters of the other Bundestag
parties. Sticking to the debt brake to prevent a reduction in energy prices,
which could potentially have climate-damaging consequences, is largely
rejected across all party lines – even among Green voters.
While the
younger generation of 18 to 39-year-olds is relatively divided and is 55
percent positive and 45 percent negative about a suspension of the debt
brake, a majority of respondents (76%) among 60 to 75-year-olds are in favor
of suspending the debt brake. (Ipsos Germany) 12 August
2022 755-43-11/Polls Only 5% Of Irish Adults Believe That The Economy
Will Improve In The Coming Six Months
Consumer
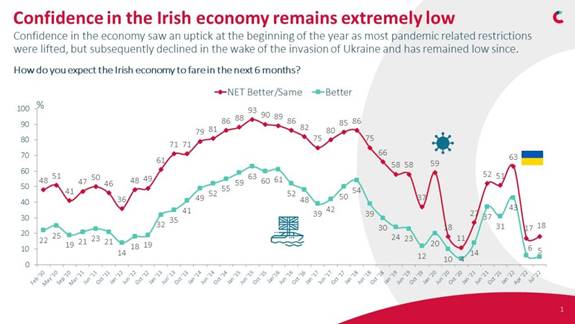
outlook on the Irish economy remains mired at an historic low-point in the
third quarter of 2022. Confidence briefly returned to a sense of optimism in
January of this year, following the removal of most COVID-19 restrictions.
However, war in Ukraine, and the threat of spiralling inflation and possible
energy and food shortages, plunged confidence back to a level only seen
during the depths of the financial crisis in 2009, and during the second
COVID-19 lockdown in October 2020, with no recovery in confidence since then.
Now, only 5% of Irish adults believe that the economy will improve in the
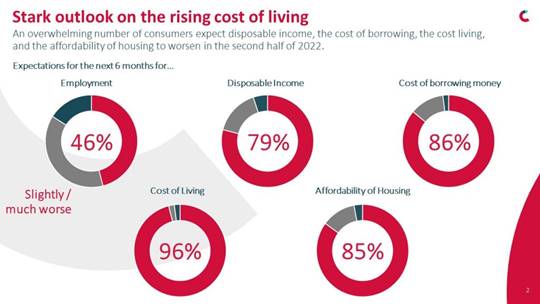
coming six months. Concerns
around the economy are manifold with the great majority of Irish adults
believing that disposable income, the cost of borrowing money, the cost of
living, and the affordability of housing will all worsen in the second half
of 2022. While still not overly positive, concerns around employment remain a
lower priority for consumers, suggesting that thus far, fears are mostly
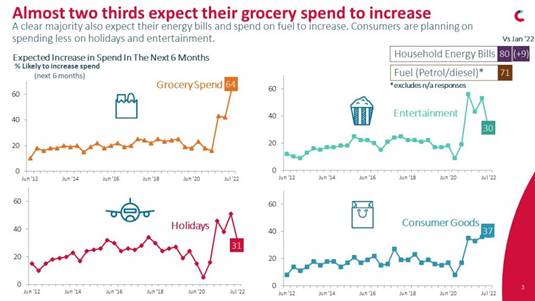
around a crisis of price and affordability, rather than one of job losses. The spectre
of inflation and the rising cost of living has become all too real for
consumers, with the highest level recorded in a decade saying they expect to
have to increase their grocery spend in the coming six months. Consumers also
expect to have to spend more on household energy bills, and on fuel.
Accordingly, consumers are planning to cut back their discretionary spending,
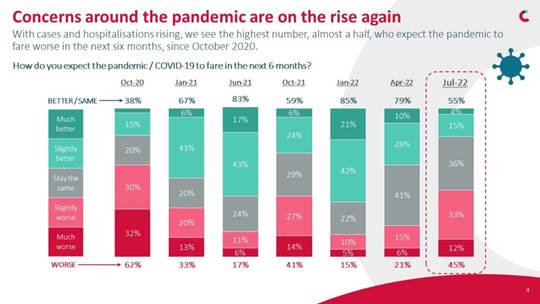
particularly on holidays and entertainment. Also
contributing to low consumer confidence are expectations that the pandemic is
to worsen in the coming six months. Rising cases and hospital admissions has
led to the highest level believing the pandemic will worsen since October
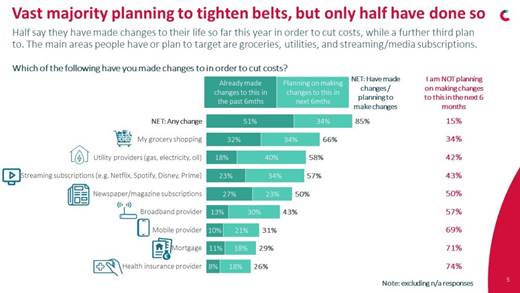
2020. Consumers
can be expected to tighten their belts in the coming six months, particularly
as winter conditions further drive-up fuel and energy bills. 85% of Irish
adults plan to make changes to their lives to cut back costs, however only a
half have done so thus far. More cutting-back can be expected as we
enter the autumn and winter, and the main areas that consumers plan to review
are their grocery shopping, utility providers, and streaming and newspaper
subscriptions. (RED C) 2022.08.09 NORTH
AMERICA
755-43-12/Polls Nearly Half Of Younger Adults Say They Wish There Were
More Parties To Choose From
Partisan polarization has long been a fact of political life in the
United States. But increasingly, Republicans and Democrats view not just the
opposing party but also the people in
that party in a negative light. Growing shares in each party now describe
those in the other party as more closed-minded, dishonest, immoral and
unintelligent than other Americans. Perhaps the most striking change is the extent to which partisans
view those in the opposing party as immoral. In 2016, about half of
Republicans (47%) and slightly more than a third of Democrats (35%) said
those in the other party were a lot or somewhat more immoral than other
Americans. Today, 72% of Republicans regard Democrats as more immoral, and
63% of Democrats say the same about Republicans. The pattern is similar with other negative partisan stereotypes: 72%
of Republicans and 64% of Democrats say people in the opposing party are more
dishonest than other Americans. Fewer than half in each party said this six
years ago. Large majorities in both parties also describe those in the other
party as more closed-minded than other Americans (83% of Democrats and 69% of
Republicans say this), and this sentiment also has increased in recent years. Yet there is one negative trait that Republicans are far more likely
than Democrats to link to their political opponents. A 62% majority of
Republicans say Democrats are “more lazy” than other Americans, up from 46%
in previous studies in 2019 and 2016.
Only about a quarter of Democrats (26%) say Republicans are lazier than
others, and this has changed only modestly since 2016. The new survey on parties and partisanship by Pew Research Center,
conducted among 6,174 Americans between June 27 and July 4, 2022, on the
nationally representative American Trends Panel, finds that negative
sentiment – the belief that the opposing party’s policies are harmful to the
country – remains a major factor in why Republicans
and Democrats choose to affiliate with their party. In fact, nearly equal shares of Republicans cite the harm caused by
Democratic policies (78%) and the positive impact of GOP policies (76%) as
major reasons why they identify with their party. This also is the case for
Democrats, with identical shares (68% each) citing these negative and
positive reasons for their decision to affiliate with the Democratic Party. The belief that the opposing party’s policies are harmful to the
country is a particularly prominent factor in why independents lean toward the
Republican and Democratic parties. It is the only one, among the five
included on this survey, cited by majorities of both Republican-leaning (57%)
and Democratic-leaning independents (55%) as a major reason why they lean
toward their parties. The survey finds that while negative partisanship remains extensive –
and in many cases is increasing – there also are signs of frustration with
the two-party system and the parties themselves. This frustration is more
evident among partisan leaners – who tend to be younger
and less politically engaged than partisans – than among those who
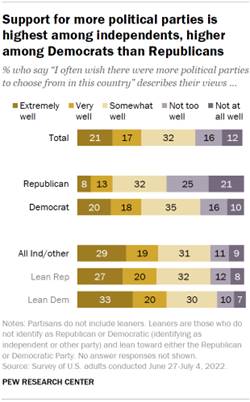
identify as Republicans or Democrats. Among the public overall, 39% say the following describes their views
extremely or very well: “I often wish there were more political parties to
choose from in this country.” Another 32% say the statement describes their
views somewhat well, while 28% say it describes their views not too well or
not at all well. Notably, Democrats are more likely than Republicans to express a
desire for more political parties: 38% of those who identify with the
Democratic Party say this describes their views extremely or very well,
compared with 21% of Republicans. Yet it is among independents and others who
do not identify with a party that the sentiment is most pronounced: 48% say
it describes their views extremely or very well, including 48% of those who
lean Republican and 53% of those who lean Democratic. Overall, interest in having more political parties is higher among
younger Americans than older adults. Nearly half of those ages 18 to 49 say
they often wish there were more parties to choose from (47% say it describes
their views extremely or very well); that compares with 35% of those ages 50
to 64 and just 23% of those 65 and older. Neither party is very
popular with the public: Roughly four-in-ten Americans (41%) have a very
or somewhat favorable view of the Democratic Party, while even fewer (37%)
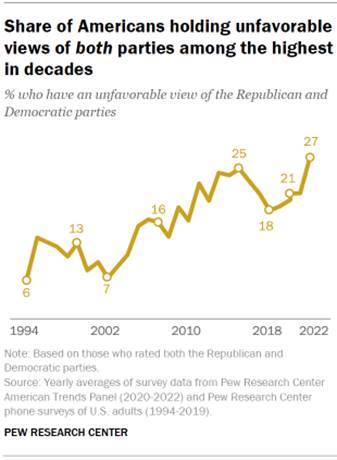
have a favorable impression of the Republican Party. Over the past several decades, the share of Americans who express
unfavorable opinions of both major
parties has grown: In 1994, just 6% of the public had an unfavorable view of
the Republican and Democratic parties. Today, about a quarter (27%) have
negative views of both parties. This view is especially pronounced among
partisan leaners: 44% of Republican-leaning independents – and an identical
share of Democratic leaners – currently have negative views of both parties. The Democratic Party has advantages over the GOP on several traits
and attributes, particularly when it comes to tolerance for different types
of people and not making
excuses for hateful views among members of their own party. About six-in-ten
adults (57%) say the phrase “respectful and tolerant of different types of
people” describes the Democratic Party very or somewhat well, compared with
38% who say it describes the Republican Party. And while 61% say the phrase “too often makes excuses for party
members who have hateful views” describes the Republican Party, a smaller
share (51%) say it describes the Democratic Party. At the same time, there are more modest differences in views of the
parties’ respect for the nation’s democratic institutions. About half of
adults (51%) say “respects the country’s democratic institutions and
traditions” describes the Democratic Party very or somewhat well, while 45%
say it applies to the GOP. And neither party gets high ratings for honesty:
43% say the phrase “governs in an honest and ethical way” describes the
Democratic Party, compared with 37% who characterize the Republican Party
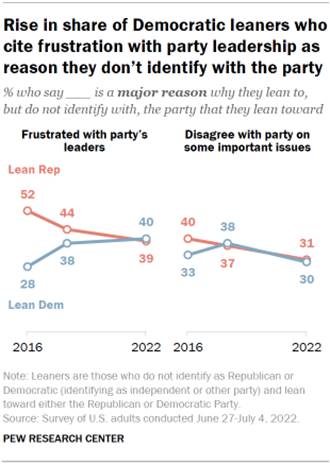
this way. Other important findings from the survey Those who lean to the Democratic Party have become more critical of
Democratic leaders. When asked why they lean toward a party – rather
than identify with it – many leaners say they do not want to put a political
label on their views, while nearly as many offer that they are frustrated
with the leadership of the party they lean toward. The share of Democratic
leaners who cite frustration with the party’s leaders as a major reason for
why they do not more closely associate with the party has risen from 28% in
2016 to 40% currently. Over the same period, the share of Republican leaners
who express frustration with GOP leadership has declined from 52% to 39%. The GOP is divided over leaders who endorse Trump’s unproven election
claims. About half of Republicans (51%) say they like political leaders
who publicly assert that Donald Trump was the legitimate winner of the 2020
presidential election; 17% say they do not like such leaders, while 31%
neither like nor dislike them. Those who identify strongly with the GOP –
strong Republicans, who make up 70% of all Republicans – are far more likely
than those who identify with the party less strongly or Republican leaners to
express positive views of such leaders. About six-in-ten strong Republicans
(59%) express positive views of leaders who say Trump won in 2020, compared
with 31% of less strong Republicans and 24% of Republican-leaning
independents. Republicans and Democrats express increasingly positive views
of themselves. While
Republicans and Democrats express increasingly negative views of those in the
other party, they have become more positive about the people in their party. For example, a
majority of Republicans (63%) now say that members of their party are a lot
or somewhat more moral than other Americans; about half of Republicans (51%)
said that in 2016 and 2019. The share of Democrats who say their fellow
Democrats are more moral than other Americans has increased from 38% in 2016
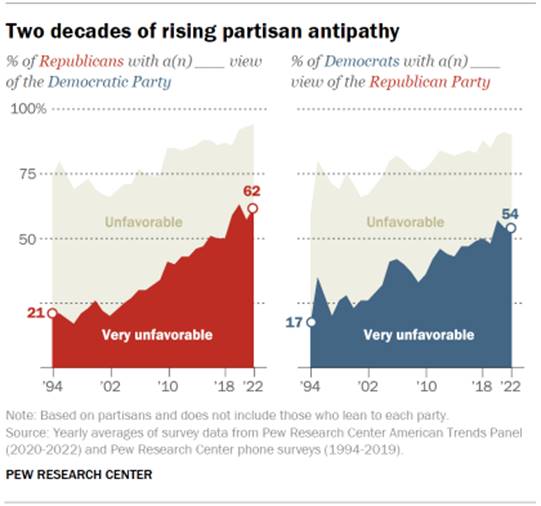
to 51% currently. Deeply negative views of the opposing party are far more widespread
than in the past. About six-in ten Republicans (62%) and more than half
of Democrats (54%) have a very unfavorable
view of the other party in Pew Research Center surveys conducted this year.
While these highly negative views of the opposing party are little changed in
the last few years, the share expressing this level of antipathy is higher
than it was even five years ago, and considerably higher than it was a few
decades ago. In 1994, fewer than a quarter in both parties rated the other
party very unfavorably. (PEW) AUGUST 9, 2022 755-43-13/Polls Just Over Half Of U S Public Schools Offer Mental
Health Assessments For Students; Fewer Offer Treatment
Citing an
“unprecedented mental health crisis” among young people in the United States,
the Biden administration recently
announced new funding to expand mental health services in the
nation’s K-12 schools. While school-based mental health services have become
more common in recent years, many K-12 schools lack such resources, according
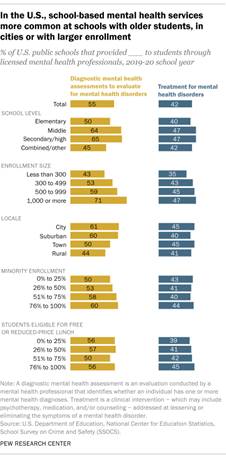
to the most recent available government data. How we did this Overall, just
over half of U.S. public schools (55%) provided students with diagnostic
mental health assessments to evaluate them for mental health disorders during
the 2019-20 school year, according to the National Center for Education
Statistics’ (NCES) School
Survey on Crime and Safety. These assessments were conducted by a
licensed mental health professional employed or contracted by the schools. Among public
schools that made mental health assessments available for students, 61%
provided them both at school and outside of school, and 29% offered them at
school only. Just 11% provided them only outside of school. Fewer public
schools provided treatment to
students for mental health disorders. In the 2019-20 school year, 42% of K-12
schools offered mental health treatment to lessen or eliminate symptoms, such
as psychotherapy, medication or counseling through a licensed mental health
professional. Most schools that offered this type of treatment (62%) provided
it both at school and outside of school. Three-in-ten provided treatment at
school only, and just 7% provided it only outside of school. The
proportion of public schools that have mental health services for students
has ticked up somewhat since the 2017-18 school year, when 51% of schools
provided mental health assessments and 38% offered treatment. Whether
mental health services were offered in the 2019-20 school year and what they
looked like varied based on a variety of school characteristics:
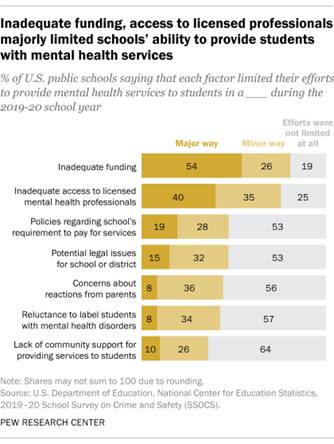
Limiting factors The School
Survey on Crime and Safety also asked schools to what extent several
factors limited their
efforts to provide student mental health services. The largest shares of
schools reported that their efforts were limited in a major way by inadequate
funding (54%) or inadequate access to licensed mental health professionals
(40%). Another 26% reported that funding limited their efforts in a minor
way, while 35% said access to mental health professionals was a minor
limiting factor. About one-in-five schools (19%) said that funding did not
limit their efforts at all, and a quarter said the same about access to
professionals. Smaller
shares of schools said that their efforts were limited in a major way by
written or unwritten policies regarding the school’s requirement to pay for
the diagnostic mental health assessment or treatment of students (19%);
potential legal issues for the school or district, such as malpractice,
insufficient supervision or confidentiality (15%); a lack of community
support for providing mental health services to students in their school
(10%); concerns about reactions from parents (8%); or reluctance to label
students with mental health disorders to avoid stigmatizing the child (8%). About
two-thirds of schools (64%) said that lack of community support did not limit
their efforts at all – the largest share saying this about any factor
included in the survey. (PEW) 755-43-14/Polls Most Americans Who Have Faced Extreme Weather See A
Link To Climate Change – Republicans Included
Extreme
weather events have affected many
parts of the United States, and most Americans who have experienced one
in the past year see at least some link to climate change, according to
a recent
Pew Research Center survey. That includes majorities in both political
parties, though Democrats are more likely than Republicans to say climate
change contributed a lot to
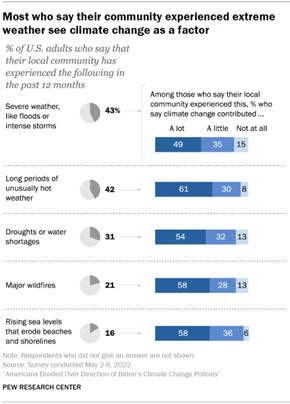
these events. How we did this Overall,
around four-in-ten Americans say their local community has experienced severe
weather like floods and intense storms (43%) or long periods of unusually hot
weather (42%) in the past year, according to the May survey of 10,282 U.S.
adults. Smaller shares say their community has experienced droughts or water
shortages (31%), major wildfires (21%) or rising sea levels that erode beaches
and shorelines (16%). The survey was conducted before recent
flooding that killed at least three dozen people in Kentucky and
before the outbreak of a major
wildfire in California. Collectively,
71% of Americans say their community has experienced at least one of these
five forms of extreme weather in the past year. Among those who have, more
than eight-in-ten say climate change contributed at least a little to each
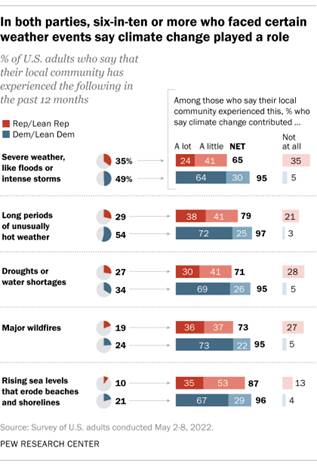
type of event. In both
parties, majorities of those who have experienced one of the forms of extreme
weather asked about in the survey say climate change contributed to the
event. But Democrats are more likely than Republicans to say climate change
contributed a lot. For example,
among those who say their community has experienced severe weather like
floods or intense storms in the past year, 95% of Democrats and
Democratic-leaning independents say climate change contributed at least a
little, compared with 65% of Republicans and GOP leaners. But while 64% of
these Democrats say climate change contributed a lot, just 24% of Republicans say the
same. Similarly,
large majorities of both Democrats and Republicans who have experienced long
periods of unusually hot weather in their community say climate change
contributed at least a little (97% and 79%, respectively). But Democrats are
far more likely than Republicans to say climate change contributed a lot (72% vs. 38%). Partisan differences persist in reported extreme weather
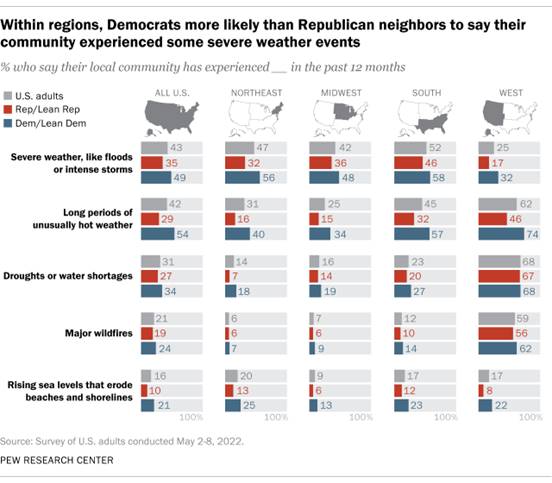
events Despite some
common ground, partisans continue to differ in their reported experiences of
certain weather events. Democrats
are more likely than Republicans to report that their local community has
faced each of the five types of extreme weather asked about in the May
survey. Previous
Center surveys have found that Democrats assign
higher priority to addressing climate change and see a stronger
link between human activity and climate change than Republicans. The partisan
gap persists even among Democrats and Republicans who reside within the same
region. In the West,
for example, 62% of adults overall report that their community has faced long
periods of unusually hot weather in the past year. That includes 74% of
Democrats in the region, compared with 46% of Republicans. Similarly, among
adults living in the South, Democrats are more likely than Republicans to say
their local community experienced severe weather like floods or intense
storms in the past year (58% vs. 46%). Partisan
differences are more muted on two other forms of extreme weather included in
the survey: wildfires and droughts. That’s especially the case in the West,
where some communities have implemented burn
bans to address wildfire threats and imposed
water restrictions to address severe droughts. Similar shares of
Democrats and Republicans in the West (62% and 56%, respectively) report
experiencing major wildfires in their community in the past year. And there
is virtually no difference in the shares of Western Democrats and Republicans
who say their community faced droughts or water shortages in the past year
(68% and 67%). Regional experiences of extreme weather Large parts
of the country have been hit by extreme weather in recent years. In 2021,
43.08% of the contiguous U.S. experienced extremes in temperature,
precipitation or drought, according to the National Oceanic and Atmospheric
Administration’s Climate Extremes Index (CEI).
The 2021 average contiguous U.S. temperature was the fourth-warmest in
the CEI’s 127-year period of record, and July 2022 was the third-hottest
July on record. Since 2019, there have been 65 weather and climate
disasters – including nine so far this year – that have each caused at least
$1 billion in damages, according to NOAA. The effects
of extreme weather are felt unevenly across the country. For instance, the
Western states of California and Nevada are especially likely to have
experienced extremes in maximum temperatures and droughts in 2021, according
to the CEI. Other parts
of the U.S. are more likely to face different weather events. In the
Southeast, for example, 46.6% of the region experienced severe moisture
surplus last year. (PEW) AUGUST 12,
2022 755-43-15/Polls Average American Remains Ok With Higher Taxes On
Rich
Calls for
higher taxes for those at the top end of the income and wealth spectrum were
a major part of President Joe Biden's 2020 presidential campaign. The
administration's interest in raising taxes on the rich has continued since
Biden took office, including the recently proposed Billionaire Minimum Income
Tax law that would require the wealthiest American households to pay a
minimum of 20% on all of their income. But the $430
billion Inflation Reduction Act passed by the Senate and about to be passed
by the House and signed into law by the president ended up with no direct
change in tax rates for rich Americans -- or any Americans for that matter.
As a report in The Hill noted,
the new legislation "leaves out most of President Biden's proposals to
pull in greater government revenues from rich taxpayers. Increases in
individual income tax rates for high earners, increases in the estate tax,
increased taxes on capital gains like stock and property holdings, a tax on
billionaires, a plan to build out the net investment income tax and a surtax
on high-income households are plans that have been scrapped from the
Inflation Reduction Act." Some of the new
law's provisions will no doubt affect the taxes of the rich (and other
taxpayers) indirectly. For one thing, the law provided billions in new
funding for the IRS. This, in turn, will lead to more frequent and stringent
audits that can ultimately result in higher taxes. Additionally, increased
taxes on corporations may affect those with stock ownership. These tend to be
higher-income individuals, although average workers' 401(k) plans and pay
raises could also be affected. And other corporate entities affected by the
bill claim their increased tax burdens will be passed on to taxpayers. But overall,
rich taxpayers, for the most part, were spared the specific or direct
increases in taxes initially envisioned by Democratic leaders. The average
American, on the other hand, would not have minded if the law had increased taxes on the rich.
Americans tend to be more likely than not to favor higher taxes on those with
high incomes. This fact of life has been well-established across a wide
variety of public opinion indicators over the years.
As a case in
point, Gallup just updated a classic question asking about taxes on the rich: This
question was first asked by Fortune back
in 1939 -- at the tail end of the depression. At that point, there were
record rates of unemployment and poverty. One might suppose that Americans
would have been very happy to agree that the rich should be heavily taxed.
But they actually weren't. In that 1939 poll, despite the challenging
economic conditions, just 35% of Americans approved of the idea, while 54%
disapproved. When Gallup
asked the question again in 1998, a slim majority of 51% disapproved. In the
nine times the question has been asked since then, positive reactions to this
idea of "heavy taxes on the rich" have been generally higher,
although variable. In 2008 and 2011, the public disapproved by slight
margins. But in surveys conducted in 2013, 2015, 2016 and in July of this
year, slim majorities approved of the idea of heavy taxes on the rich in
order to redistribute wealth. The latest results are 52% approve, 47%
disapprove. In short,
the question confirms the well-documented finding noted above. Americans tend
to agree with the idea that those with more money should pay even more in
taxes than they do now. Attitudes on Taxing the Rich Vary by Partisanship, Question
Wording As is often
the case, American public opinion on taxing the rich varies depending on how
the policy is explained. And it is not constant across all population
segments. For one
thing, not surprisingly, Democrats are much more likely than Republicans to
favor heavy taxes on the rich. This partisan gap has been significant and
consistent over the years. About seven
in 10 Democrats and Democratic-leaning independents have supported heavier
taxes on the rich each time the classic Gallup question has been asked since
October 2008. That compares to a consistent third or less of Republicans. In
July's update, 79% of Democrats support the idea of heavy taxes on the rich;
24% of Republicans agree. The partisan gap seen since October 2008 is
slightly larger than it was in 2007 and April 2008.
All other
questions asking about taxes on the rich with which I'm familiar show this
same type of partisan division. Democrats tend to favor redistribution.
Republicans do not. Attitudes
also vary depending on how taxing-the-rich policies are explained in survey
question wording. The Gallup
trend question is noteworthy because of its specific language. The question
asks directly about how far "a government" should go; it talks
about redistributing wealth, and it asks about "heavy" taxes on the
rich. Questions using what I would typify as more temperate wording produce
higher support for the concept of taxing the rich. As one
example, Gallup has asked
the public for many years about the tax burden imposed on various
segments of society. Gallup's question gives Americans a choice in saying
that each segment pays their fair share, too much or too little. With only
one exception, at least six in 10 Americans for over a quarter of a century
have agreed that upper-income Americans pay too little in taxes. This
includes 62% in Gallup's latest update in 2018. Another
Gallup question asks about money and wealth redistribution more generally. As
of 2016, well
over half of Americans said that "money and wealth in this
country should be more evenly distributed among a larger percentage of the
people." Similar responses were obtained every time the question has
been asked going back to 1985. Many other
polls confirm these basic findings. Fairly large majorities of Americans
favor the concept of higher taxes on the rich, with exact percentages
dependent on how the concept is explained.
Although the
specific percentages vary, the general results are so consistent that a Money headline a couple of years
ago proclaimed, albeit with some hyperbole, "Most Americans Want the
Rich to Pay Higher Taxes, According to Every Poll Everywhere." The general, abstract idea of reducing the gap
between roles with the highest incomes and those with the lowest incomes, in
short, clearly resonates with Americans' underlying attitudes. Not an Evidently High Priority Over six in
10 Americans are dissatisfied with the way income and wealth are distributed
in the U.S. Almost three-quarters
worry about the issue, with 46% saying they worry a great deal. It is,
however, hard to find evidence that reducing inequality translates into a top
priority for Americans. Negligible numbers of Americans mention income or
wealth inequality as the
most important problem facing the nation. Pew Research noted in reviewing
a 2019 poll that few Americans see reducing economic inequality "as a
top priority for the federal government to address." And Gallup research
conducted in 2018 found the
distribution of income and wealth dead last on a list of priorities
for the president and Congress. Bottom Line How valued
resources are distributed across all members of a society is among the most
important challenges a society faces. No social system distributes resources
equally. This leaves the inevitable reality of "inequality" where
some end up with more than others. Dealing with this inequality has been one
of society's most significant challenges throughout history. And it remains
so today. The people
of the United States have addressed inequality in many ways throughout the
nation's history. In particular, the government has for over a century
carried out a progressive tax system that extracts higher percentages of
taxes from those with the most income. The American
public, taken as a whole, approves of this progressive system. The majority
of the public would like to see taxes become even more progressive. But
today's political realities don't appear conducive to an agreement on new
taxes on the rich. Rank-and-file Republicans, and their leaders in Congress,
remain strongly opposed to new taxes. And, as evidenced by the new Inflation
Reduction Act about to become law, Democratic leadership has, in the end,
decided to proceed without arguing or attempting to change the fundamentals
of the individual tax system. What might happen in the future, of course,
remains to be seen. (Gallup) AUGUST 12,
2022 755-43-16/Polls As Gun Violence Remains A Major Concern, Americans
Favor Stricter Regulations
The latest
FiveThirtyEight/Ipsos Election Tracking poll finds crime or gun violence
remains among Americans’ top concerns, albeit distantly behind inflation for
most, and that a majority believe gun violence is a larger issue than crime.
At the same time, just over six in 10 Americans believe it is more important
to control gun violence than protect gun rights, and that the U.S. should
have stricter restrictions on gun ownership. In fact, a number of possible restrictions
garner bipartisan support. Two and a
half months after the mass shooting at Robb Elementary in Uvalde, TX, the
poll also explores perceptions of what could make schools safer and the share
of Americans that have experienced lock down drills to prepare for an active
shooter during their K-12 education.
Click the
following to learn more: https://fivethirtyeight.com/features/how-democrats-and-republicans-think-differently-about-crime-and-gun-violence/ Detailed Findings 1. Crime or
gun violence continues to rank among Americans’ top concerns. When forced to
choose, more are concerned about gun violence than crime, though this differs
based on party affiliation.
2. Across a
series of true or false statements, Americans demonstrate relatively low
knowledge of crime and gun violence statistics.
3. In
general, Republicans do not favor stricter gun laws. However, many potential
initiatives garner majority support across both sides of the aisle (and among
independents).
4. A narrow
majority of Americans believe an increased police presence at schools would
make them safer. However, few believe arming teachers would make schools
safer.
(Ipsos USA) 10 August
2022 Source: https://www.ipsos.com/en-us/news-polls/FiveThirtyEight-2022-midterm-election 755-43-17/Polls Majority Of Canadians View Pope Francis’ Apology For
Residential Schools As A Step Towards Reconciliation
A new study
from the non-profit Angus Reid Institute finds a majority of Canadians view
Pope Francis July visit to Canada – dubbed the “penitential
pilgrimage” – and the apology he offered on behalf of members of the
Catholic Church for their role in the administration of residential schools,
as a step towards reconciliation. Overall,
three-in-five (59%) say this, while one-in-three (32%) feel the apology does
nothing to move reconciliation forward. Respondents are twice as likely to
view it was a “small step” (40%) than a “significant” one (18%). Among a
sample of Indigenous respondents, opinions are similar but more muted, with
54 per cent feeling this was a contribution to reconciliation, and 36 per
cent feeling the gesture offers no real practical impact. Pope Francis
undertook the summer visit to Alberta, Quebec, and Nunavut to offer his
apologies to Indigenous communities. Between 1883
and 1996, an estimated 150,000 Indigenous children were forced to attend
residential schools in Canada, more
than 60 per cent of the schools were run by the Catholic Church. The apology
itself is largely viewed as sincere by those who followed the trip and Pope
Francis’ speeches. Two-thirds (64%) of those who paid attention to the visit
say the pope was sincere in his lamentation of the “evil”
perpetrated by some members of the church during this period. One-quarter
(24%) of Canadians disagreed that the apology was genuine. Asked who
bears most responsibility for the residential school system, half of
Canadians (52%) blame the federal government, Christian churches, and society
at the time equally for creating it and allowing it to persist. One-in-five
say the federal government bears most blame (21%), while a similar number
primarily blame the church (18%).
More Key Findings:
About ARI The Angus Reid
Institute (ARI) was founded in October 2014 by pollster and
sociologist, Dr. Angus Reid. ARI is a national, not-for-profit, non-partisan
public opinion research foundation established to advance education by
commissioning, conducting and disseminating to the public accessible and
impartial statistical data, research and policy analysis on economics,
political science, philanthropy, public administration, domestic and
international affairs and other socio-economic issues of importance to Canada
and its world. *A note on sample. The Angus Reid Institute collected
responses from those who self-identify as Indigenous in this survey. This is
not representative of all Indigenous experiences and perspectives. The total
number of responses from Indigenous individuals (127 responses) was weighted
to be statistically representative in the Canadian population at four per
cent (117 responses). Please consider these views as informative but not
authoritative. INDEX Part One:
Papal visit
Part Two:
Looking forward and back
Part One: Papal visit Pope Francis
came to Canada for a week-long “penitential
pilgrimage” last month. He visited Alberta, Quebec and Nunavut, stopping
at churches, former residential school sites and Indigenous sacred sites. The
trip centred around the pope delivering
apologies in Canada for the
role members of the Catholic Church played in administering
residential schools after he apologized to an Indigenous delegation to
Vatican City earlier
this year. Attention meagre for pope’s visit While Pope
Francis’ trip spanned two provinces and one territory – the
first papal visit to Canada in 20 years – attention across the
country to his summer visit was relatively low compared to other recent news
events. Just six per cent of Canadians say they followed the trip closely and
the overall score on the Angus Reid Institute’s Engagement Index is well
below average:
Apology viewed as sincere by those who followed For some,
such as former
Assembly of First Nations Chief Phil Fontaine, the apology represented a
step forward towards healing and forgiveness of the Catholic Church. For
others, it reopened a wound that has yet to be healed, highlighting the
need for more concrete action towards remedying the harms of the past. Half (49%)
of Canadians believe the apology was sincere. However, those who were more
closely following news of the pope’s cross-country visit are much more likely
(64%) to believe the apology came from the heart:
Majority see visit and apology as a productive step toward
reconciliation The Congress
of Aboriginal Peoples National Chief Elmer St. Pierre called the apology “a
significant first step towards reconciliation.” Still others believe that
there is much
more work to be done, including the release
of documents related to residential schools held in the Vatican. One-in-five
(18%) agree with St. Pierre and say the apology was a significant step
towards reconciliation. Twice as many (40%) say it was a small step.
One-third (32%) feel the apology achieved nothing in regards to
reconciliation. Canadians
over the age of 64 are more likely to say it represented progress towards
reconciliation; seven-in-ten (68%) say so:
Canadians
who identify as Indigenous are less likely than those who don’t identify as
such to believe the pope’s apology was a step towards reconciliation. In
fact, as many in that group say it didn’t make a difference (36%) as would
call it slight progress (35%):
Part Two: Looking forward and back Half say all parties to blame for residential schools The Catholic
Church played a significant role in residential schools – running
the majority of them – but there were many other Canadian
institutions and individuals involved in the more
than 160-year long tragedy. Half (52%)
of Canadians say the federal government, Christian churches and society as a
whole at the time share equal responsibility for residential schools.
One-in-five (21%) level most of the blame at the federal government for
creating and enforcing attendance at the schools. The same proportion (18%)
say the Christian churches should be blamed the most for operating the
schools. One-in-ten (9%) blame society as a whole at the time the most for
accepting the residential school system:
Relationship between Canada and Indigenous people seen as
improving Respondents
were first asked, before any other questions regarding the pope’s visit,
about their own perceptions of the current relationship between the country
and Indigenous peoples. Overall, the trend is seen as more positive than
negative. More than two-in-five (44%) Canadians say the relationship is
improving, while 13 per cent feel the situation has worsened. One-in-three
(35%) say that there has been little progress or regress. There are, however,
considerable differences in optimism generationally, with older Canadians
more positive. Additionally, non-Indigenous respondents are also more
positive:
This
optimism or pessimism about this relationship colours views of Pope Francis’
apology. Those who feel the situation is improving are much more likely to
say that this is a positive step toward reconciliation, while those who
perceive stagnation or a worsening of the relationship are much less likely
to agree:
Division over how to move forward Canadians
are more likely to believe there needs to be more investigations into
residential schools before the country can move forward (58%) than not (42%),
but there is a significant generational and gender divide on this matter.
Women, and younger ones especially, are much more likely to believe more work
is needed. Men are more likely to say enough attention has been paid to
residential schools and that it’s time to move forward:
(Angus Reid
Institute) August 11,
2022 Source: https://angusreid.org/pope-apology-residential-schools-indigenous-canada/ AUSTRALIA
755-43-18/Polls The ALP In Victoria Increases Its Large
Election-Winning Lead From A Month Ago, ALP 60.5% cf L-NP 39.5%
The result
of the Roy Morgan Snap SMS Poll represents an increase in support for the ALP
of 3.2% points from the 2018 Victorian State Election won by the ALP 57.3%
cf. L-NP 42.7% and the Government led by Premier Daniel Andrews is on track
to increase its already large majority in the Victorian Parliament. ALP
two-party support in Melbourne is 61.5% while 58.5% in the rest of Victoria.
Although the ALP has increased its two-party preferred result since early
July, primary support for both major parties is down. Support for the ALP is
down 3% points to 40.5% while support for the L-NP was down by 2% points to
27.5%. Support for the Greens increased, up 2% points to 14%. The total
support for other minor parties and independents has increased by 3% points
to 18%. This includes Clive Palmer’s United Australia Party on 2% (unchanged),
Derryn Hinch’s Justice Party on 1.5% (up 0.5% points). A further 5% of
Victorians support a ‘Teal Independent’, up 2% points from early July while
9.5% (up 0.5% points) support Other Parties or Independents. This special
Roy Morgan Snap SMS Poll was conducted with a Victoria-wide cross-section of
1,097 Victorian electors aged 18+ conducted from Thursday August 11, 2022, to
Saturday August 13, 2022. Approval for Premier Daniel Andrews remains strong and
Andrews has increased his lead over Opposition Leader Matthew Guy as
preferred Premier This Roy
Morgan Snap SMS Poll found 62.5% (down 1% point since early July) of
Victorian electors approve of the way Premier Daniel Andrews is handling his
job, while 37.5% (up 1% point) now disapprove. Electors
were then asked “Thinking of Premier
Daniel Andrews and Opposition Leader Matthew Guy. In your opinion, who would
make the ‘Better Premier’?” The contest
between the two leaders is clearly in favour of the incumbent with 66% (up
1.5% points) of electors saying Daniel Andrews ‘Would make the better
Premier’ compared to only 34% (down 1.5% points) say Matthew Guy – a margin
of nearly 2:1 in favour of the incumbent. Daniel Andrew’s support ’to make
the better Premier’ is higher in Melbourne (68%) than the rest of Victoria
(61.5%). Electors
were then asked: “What, if anything,
would concern you about a re-elected ALP Government under Premier Daniel
Andrews?” and “What,
if anything, would concern you about a potential Liberal-National Government
led by Matthew Guy?” In terms of a re-elected ALP Government led by
Victorian Premier Daniel Andrews there were several key themes that emerged
including many mentions of allegations of corruption and the personal lack of
accountability of Premier Andrews for his actions. Many respondents
referred to his lack of integrity, his dishonesty and lies while the theme of
cost over-runs, reckless spending and high debt levels was also prominent.
There were several respondents that described Andrews as ‘arrogant’ and with
a ‘dictatorial governing style’ and concerns about the state of health care
in Victoria, but the vast majority of ALP supporters said there was ‘nothing’
that concerns them. In relation
to a potential Liberal-National Government led by Matthew Guy the alleged
corruption was a major issue that emerged, along with ‘jobs for mates’ and
questions regarding his integrity. Many
respondents cited Guy’s lack of experience and general incompetence for
leadership as concerns. There were also significant worries about Guy’s
weakness as a leader and that he is ‘not strong enough’ as a leader which
creates a divided and dysfunctional party. There were
also concerns about the religious influences within the Liberal Party and
respondents also questioned their policies on climate change, first nations
reconciliation and the impression the Liberal Party is only out to look out
for its mates, the big end of town. A significant number of respondents
simply said “everything” concerns them about a potential L-NP Government led
by Matthew Guy though most Liberal supporters stuck by their party and said
there was ‘nothing’ that concerned them. (Roy Morgan) August 14
2022 MULTICOUNTRY
STUDIES
755-43-19/Polls Average Rate Of Inflation In FMCG Kantar Baskets
Across All 5 Latin American Countries Has Reached 10.4%
Tackling
inflation is a daily challenge for Latin American consumers, and the mission
to balance household bills has required them to adapt their shopping
behaviour. Since prices are constantly rising, and shoppers’ FMCG purchasing
power is currently 20% lower than it was in 2021, consumers need to find ways
to reduce their expenditure. When faced
with financial pressure, buyers are using a number of different levers to
manage their spending. These go
beyond the responses that might be expected – such as buying larger packs or
purchasing smaller amounts. These tactics are an important part of the
equation, but Latam consumers are also spending more of their money in
cheaper stores, buying more or deeper promotions, and investing their money
in different levels of products – both trading up to premium versions and
trading down to budget options. Tracking all
these aspects over time offers us a clear view of Latam shoppers’ reactions
to recessive pressure, in different markets across the region. The case of
Central America The average
rate of inflation in FMCG Kantar baskets across all Latin American countries
has reached 10.4% in Q4’21. The approach shoppers have taken to deal with
that is by reducing the average volume bought per household, and searching
for the store format that will offer them the most profitable relationship.
At the same time – and perhaps an unexpected reaction – they have replaced
previous product choices with higher value items, a way to preserve the
investment.
Context
changes between categories If we take a
closer look at how FMCG categories have evolved, we can see evidence that shoppers
are being exposed to different price-change trajectories within the basket.
Each category behaves differently because of inflation, and shoppers are
striving to mitigate price increases through the purchased product options. Cooking
sauce, for example, is considered a non-essential category and households are
employing all the cost-saving mechanisms available to them, including
reducing the volume they buy.
On the other
hand, drinking coffee is a daily habit for many shoppers that they find it difficult
to break, so to combat inflation they are maintaining the volume purchased
while downgrading to a lower-priced brand instead, or buying more products on
promotion.
If you would
like to understand the evolution of the FMCG sector considering main levers
to purchases in each country of Latin America, please contact our team. We
can also deepen the analysis focusing on the retail market, in your category
or even in sociodemographic details. (Kantar) 10 August
2022 Source: https://www.kantar.com/inspiration/fmcg/how-do-latin-american-buyers-respond-to-financial-pressure 755-43-20/Polls 8% Of The World's Population Will Still Be Undernourished
In 2030, A Worldwide Study By Food And Agriculture Organization
Despite
hopes that food security -- which suffered major setbacks in 2020 -- would
start to recover in 2021, the latest State of Food Security and Nutrition in the World report (SOFI)
shows that 2021 brought further setbacks. World hunger
and severe food insecurity grew, making the world's goal of achieving
"zero hunger" by 2030 even more unlikely. In fact, according to
current projections from the Food and Agriculture Organization of the United
Nations (FAO), 8% of the world's population will still be undernourished in
2030 -- just as much as when these goals were first set in 2015. The report
released in July draws on data from many sources, including food security
data collected for the FAO in the Gallup World Poll*, to provide the latest
update on the world's progress toward ending hunger and ensuring food
security in the second full year of the pandemic. Key Findings Although the pace slowed, the proportion of people facing
hunger continued to rise in 2021. After
remaining basically unchanged for five years, the prevalence of
undernourishment** -- the FAO's traditional indicator of the extent of hunger
-- increased from 8.0% to 9.3% between 2019 and 2020. It kept rising in 2021,
although at a slower pace than the year before, reaching 9.8%.
Hunger
continued to increase in most regions of the world. As a share of its
population, Africa continued to bear most of the burden, with one in five
people -- or an estimated 278 million -- facing hunger in 2021. However, more
than half of the people in the world affected by hunger in 2021 -- 425
million -- live in Asia. The war in Ukraine could make hunger worse for millions. The war in
Ukraine, which involves two of the world's biggest producers in agriculture
and staple cereals, could drive hunger numbers even higher in the short and
medium term. FAO
simulations suggest that in a severe-shock scenario, 13 million more people
could be undernourished in 2022 -- and reach as high as 19 million more in
2023. Populations already facing hunger and food crises -- in sub-Saharan
Africa, the Near East and North Africa -- are most at risk of higher
undernourishment.
Three bar
graphs. These depict the estimated impact of the war in Ukraine on the global
number of undernourished people in 2022. The "base" number, which
does not take the war in Ukraine into account, is 733.9 million people
worldwide. The moderate scenario is 741.5 million people, and the extreme
scenario is 747.0 million people. Overall food insecurity remained mostly unchanged, but
severe food insecurity increased. Moderate or
severe food insecurity at the global level has slowly been rising since 2014,
when the FAO first started collecting data annually using the Food Insecurity
Experience Scale (FIES) informed by Gallup's World Poll and other sources.
But in 2020, moderate or severe food insecurity rose nearly as much as it had
in the previous five years -- combined. The 2021
data show overall food insecurity remained stable, but severe food insecurity
-- which means people had run out of food or, at worst, gone a day without
eating -- rose. Severe food insecurity increased from 10.9% in 2020 to 11.7%
in 2021. An estimated 923.7 million people faced severe food insecurity in
2021, up 73.6 million from just the year before. Moderate and
severe food insecurity increased most in Africa, where more than one-third of
the total number of people facing severe food insecurity live. An estimated
322 million Africans in 2021 were facing severe food insecurity -- 21.5
million more than in 2020 and 58 million more than in 2019 before the
COVID-19 pandemic. Food
insecurity also continued to worsen in Latin America and the Caribbean.
Roughly 10 million more people were facing severe food insecurity in 2021
than the year before -- and almost 30 million more were facing severe food
insecurity than in 2019. In the region, severe food insecurity has nearly
doubled since 2014. The gender
gap in food security widened even further in 2021: 31.9% of women were
moderately or severely food insecure, compared with 27.6% of men. In every
region except Africa, food security among men improved, while it worsened
among women in every region except Asia. The increase
in the gender gap globally from 2020 to 2021 was driven largely by the
widening differences in Latin America and the Caribbean, where the gap
between men and women increased from 9.4 percentage points in 2020 to 11.3
points in 2021. The gap also expanded in Asia, from 2.7 points in 2020 to 4.4
points in 2021. Implications Just eight
years away from 2030, the latest SOFI report shows the world continues to be
headed in the wrong direction in its fight to end world hunger, food
insecurity and malnutrition. Although the pace in the increase in hunger
slowed in 2021, it continued to rise, and hunger affected tens of millions
more people than it did the year before. The increase
in global hunger in 2021 reflects the lingering effects of the COVID-19
pandemic and the unequal pattern of economic recovery that took place last
year. Many of the people most affected by the pandemic did not recover the
incomes that they lost, which exacerbated existing inequalities and made food
security situations worse for populations that were already struggling before
the pandemic. Finding a
path forward in these challenging and uncertain times -- as food prices rise
and recession looms -- will require governments to start rethinking how they
allocate their funding and use the resources they already have to fight
hunger. (Gallup) AUGUST 10,
2022 Source: https://news.gallup.com/opinion/gallup/395984/world-hunger-severe-food-insecurity-grew-2021.aspx 755-43-21/Polls Partisanship Colors Views Of Covid-19 Handling
Across 19 Advanced Economies
Publics are
increasingly satisfied with the way their country is dealing with the
COVID-19 pandemic, according to a recent Pew Research Center survey in 19
countries. A median of 68% think their country has done a good job dealing
with the coronavirus outbreak, with majorities saying this in every country
surveyed except Japan. However, as the survey also highlights, most believe
the pandemic has created greater divisions in their societies and exposed
weaknesses in their political systems. And across these nations, partisan
divisions play a key role in shaping attitudes toward the pandemic. Overall, a
median of 61% think their country is more divided now than it was prior to
the outbreak of the pandemic, compared with a median of 32% who think their
society is now more united. As was also
the case in 2021, the United States has the highest share who say the
country is more divided than before the pandemic, with 81% holding that view.
Around three-quarters or more also see disunity in the Netherlands, Germany,
Canada and France. Only in Singapore, Sweden and Malaysia do majorities feel
more united than
before the pandemic. Many also
believe the pandemic has revealed weaknesses in their political systems. On
balance, more people say their country is failing to handle the COVID-19 outbreak in ways that
show the weaknesses of
their political system (a median of 52%) than see their country effectively handling the pandemic
in ways that show the strengths of
their system (a median of 44%). In the U.S., around two-thirds see the
country struggling in ways that reveal political weakness, and a majority
also feels this way in the Netherlands, Greece, Germany, Japan, Australia and
South Korea. Only in Singapore, Hungary, Israel and Sweden does a majority
feel the opposite – that the way their country has handled the coronavirus
outbreak highlights their country’s political strengths. All of these
opinions about the COVID-19 pandemic and its effect on government and society
are heavily colored by partisanship. In almost every country, supporters of
the governing party are much more likely to say their government is handling
the coronavirus outbreak well, to say their country is handling the pandemic
effectively in ways that show the strengths of the political system and to
say their country is more united compared with before the COVID-19 pandemic
than people who do not support the governing party (for more on how the
governing party in each country is defined, see Appendix
A). In many cases, the differences are quite substantial. For example,
Poles who support Law and Justice (PiS) are around twice as likely – or more
– than those who do not support the governing party to say the government has
done a good job (89% vs. 44%, respectively), to say the country is united
(55% vs. 20%) and to believe the pandemic has illuminated the political
system’s strengths (83% vs. 28%). Views of the
economy are also closely related to all of these opinions. Those who say
their economy is in good shape are much more likely to approve of their
government’s handling of the pandemic and to say their government’s response
highlights the strengths of their political system than those who think the
economy is in bad shape. People with rosy views of the economy also see the
country as more united than those who have bleaker economic assessments. The survey
also asks about the relative importance of getting a coronavirus vaccine to
be a good member of society.1 In
every country, around two-thirds or more say it’s at least somewhat important
to do so. But the share who says it’s very important
to get the COVID vaccine in order to be a good member of society varies
widely, from around four-in-ten or fewer who say this in France, South Korea,
Hungary and Poland to around seven-in-ten or more who feel this way in
Singapore, Sweden and Spain. And, in this case, opinion is related to
on-the-ground reality: Countries with higher shares of people who report that
it’s very important to get vaccinated also have higher rates of vaccination
across the population. Still, as
with all other coronavirus-related attitudes explored here, the perceived
importance of the vaccine is heavily partisan in nature. In every country
surveyed, those who support the governing party or coalition are much more
likely to say it’s very important to be vaccinated than those who do not
support the ruling party. In Canada, for example, 80% of those who support
the governing Liberal Party think getting a vaccine is very important,
compared with 51% of those who do not identify as Liberal partisans. In many
countries, those on the ideological left are significantly more likely than
those on the right to say getting a coronavirus vaccine is very important.
However, this pattern is reversed in Hungary, Poland and Greece, each of
which has a governing party on the ideological right. The U.S. is exceptionally divided on the pandemic The U.S. is
one of the most divided countries when it comes to attitudes about the
coronavirus outbreak. For example, the partisan gap over the importance of
getting a COVID-19 vaccine is 44 percentage points, with Democrats and
independents who lean toward the Democratic Party far more likely than
Republicans and GOP leaners to say getting a vaccine is very important. Relatedly, 68% of Americans
on the ideological left (liberals, in American parlance) report that
it’s very important
to get a coronavirus vaccine to be a good member of society, compared with
22% of those on the right (conservatives). This ideological divide is the
largest among the 19 countries surveyed. And, indeed,
Americans do stand out among all 19 countries surveyed for being the most
likely to perceive division
in the country and the most likely to say that the country’s response to the
pandemic has highlighted the failings of the political system. In fact, only
in the U.S. does a majority of even the governing
party supporters – Democrats, in this case – say the virus has laid bare the
country’s political failings. (For more on U.S. attitudes about the
coronavirus pandemic, see “Americans
Reflect on Nation’s COVID-19 Response“.) These are
among the major findings of a new Pew Research Center survey, conducted from
Feb. 14 to June 3, 2022, among 24,525 adults in 19 countries. The survey also
finds substantial age gaps in many countries across the four questions
analyzed in this report. In most countries surveyed, adults over age 50 are
much more likely than adults ages 18 to 29 to say the coronavirus outbreak
has been handled well and to say that their country is effectively handling
the outbreak in ways that show the strengths of the political system. In over
half the surveyed countries, older people are also more likely to think their
country is now more united than before the coronavirus outbreak. Finally,
older adults are likelier to say that getting a coronavirus vaccine is
important to being a good member of society in nearly every country surveyed. Most look favorably upon their country’s COVID-19 response Even
as COVID-19
variants have risen and fallen and pandemic
policies have ebbed and flowed, majorities in most places approve of
their country’s coronavirus response: A 19-country median of 68% say their
government has done a good job dealing with the pandemic, while a median of
32% say their country has done a bad job. Positive
feelings are most common in Singapore, where nearly nine-in-ten adults say
the city-state has done a good job dealing with the coronavirus outbreak.
Singapore abandoned
its “zero COVID” policy last October, but it was largely successful
at suppressing the spread of the virus prior to the development of
effective vaccines. Ratings are
also very high in Sweden, where the government bucked
the international consensus and refused
to implement mandatory restrictions early on to reduce the spread of
the virus. About eight-in-ten Swedes say their country has done a good job
dealing with the coronavirus outbreak. Opinions are
least positive in Japan, where 52% say the government’s response to the
coronavirus outbreak has been good and 47% say it has been bad. In many
countries, adults are now happier with their government’s COVID-19 response
than they were last spring. Belgium, in particular, has seen an increase in
the share who say the country has handled the coronavirus outbreak well. In
2021, half of Belgian adults thought their government had done a good job
dealing with the pandemic. Now, nearly
three-quarters of Belgians (73%) rate the response positively. Ratings have
also significantly improved in Spain, Japan, the U.S., France, Italy, Sweden,
Germany and Canada. In three
countries, however, coronavirus response assessments have become more
critical. South Korea reports a 13-point decrease in the share who say that
their country has done a good job responding to the coronavirus outbreak.
Opinions in Singapore are down slightly, from 97% in 2021 to 88% in 2022.
Australia, which in 2020 and 2021 had near unanimous agreement that the
country had done a good job dealing with COVID-19, shows a 19-point decline
in the share who say that in 2022. Since the question was last asked in
2021, Australia
ditched its “COVID zero” stance after frequent mass lockdowns in
many state capitals and the spread of the delta variant. Pandemic response
ratings are significantly more positive among supporters of the governing
party or parties than nonsupporters in every country but Malaysia. For
example, 72% of supporters of German
Chancellor Olaf Scholz’s three-party “traffic light coalition” say
Germany’s pandemic response has been good, while only 57% of nonsupporters
hold that view – a difference of 15 percentage points. Views of
COVID-19 responses are also closely tied to assessments of the current
economic situation. As many countries grapple
with rapid inflation, supply
shocks from the Russian invasion of Ukraine and the threat of
global growth slowdown, the economic recovery from the pandemic has been
unsteady. Those who have positive views of the current economic situation in
their country are more likely to think their country’s coronavirus response
has been good in every country surveyed. This includes double-digit
differences in all countries surveyed and differences of 30 points or more in
9 countries. Though there
was a strong relationship between positive assessments of a country’s
handling of the pandemic and the number of virus-related deaths in that
country in
2021, the same is not true in 2022. In fact, views of a country’s handling
of the pandemic in 2022 are largely unrelated to the number of deaths in the
country, the number of cases or the vaccination rates. Most people say the pandemic has divided their society Across the
19 countries surveyed, people largely feel their society is more divided now
than before the coronavirus outbreak. A median of 61% feel the pandemic has
divided their country, while only 32% think it has left their country more
united than before. This includes majorities in 13 countries who say their country
is more divided than before the pandemic. Once again,
the U.S. is the country with the highest
share who say that the country is more divided than before the
pandemic, with 81% holding that view. About eight-in-ten in the Netherlands
and Germany also feel their respective countries have seen increased division
since the coronavirus outbreak. Singapore,
Sweden and Malaysia stand out for having majorities say their country is now
more united than
before the pandemic. Views in Japan, Belgium and Italy are split, with some
seeing increased division and others seeing increased unity. While
perceptions of pandemic-related division continue to be common in many
countries, they are nonetheless also significantly down from last year in
several countries. For example, 59% of Japanese adults said their country was
more divided than before the pandemic, when asked in 2021 just
ahead of the Tokyo Olympics. Today, only 40% in Japan say the country is
more divided. Double-digit decreases in the share who say their country is
more divided also appear in Belgium, Sweden, Spain and Italy. In Canada
and Australia, the opposite is true. The share of Canadians and Australians
who say their country is more divided has steadily increased since the
question was first asked in the summer of 2020. Though
majorities in many countries see increased social divisions, the question of
the pandemic’s effect on national unity is itself divisive. One major divide
is between those who support the governing party or parties in their country
and those who do not. In every country but Germany and the Netherlands, those
who do not support the governing party or parties are more likely to see
increased division than those who support the party or parties in power. For instance, only
three-in-ten Poles who support the ruling Law and Justice Party (PiS)
say there has been increased division since the coronavirus outbreak; among
those who do not support PiS, two-thirds say Poland is more divided. More say COVID-19 exposed the weaknesses in their political
system than the strengths In most
countries surveyed, half or more say their country is failing to effectively
handle the pandemic in ways that show the weaknesses of their political
system. Overall, a median of 52% across the 19 countries surveyed see their
country struggling in a way that reveals their political weaknesses. While
this opinion is highest in the U.S., where 66% feel that way, a majority
share the sentiment in the Netherlands, Greece, Germany, Japan, Australia and
South Korea. Still, a
median of 44% say the opposite – that their country is effectively handling
the coronavirus outbreak in ways that show the strengths of their political
system. This opinion is highest by far in Singapore, where around
three-quarters hold this view, but a majority also feel this way in Hungary,
Israel and Sweden. People who
support the current party or parties in power are much more likely to say
their country is effectively handling the COVID-19 outbreak in ways that show
the strengths of their political system than those who do not support those
currently in office. In some countries, these differences are massive. For
example, in Greece, 79% of those who support New Democracy (ND), the party
currently in power, think that their country’s effective handling of COVID-19
highlights the strengths of the Greek political system, while only 20% of those
who do not support ND feel the same. In Poland,
too, the difference between Law and Justice supporters and others is 55
percentage points and in France, En Marche supporters differ from others by
45 points.2 While there
is also a partisan gap in the U.S., the gap is somewhat smaller: 42% of
Democrats and independents who lean toward the Democratic Party think how the
U.S. has handled the pandemic demonstrates the strengths of the political
system, compared with 19% of Republicans and GOP leaners. Notably, the U.S.
is one of the only countries where a minority of those who support the
governing party think their political system appears strong on the basis of
its pandemic approach. The same is
true when it comes to whether people think their country is more united or
divided now than it was before the pandemic. In every country, those who
think the country is now more united than it was before are more likely to
say COVID-19 highlighted the strengths of their political system than those
who think their country is more divided. The magnitude of these differences
is often quite sizable. For example, in Australia, 73% of those who think the
country is now more united say they see the strengths in their political
system thanks to the pandemic, compared with 32% of those who think the
country is now more divided. In most
countries surveyed, older people are more likely than younger people to say
that the way their country has handled the coronavirus outbreak shows the
strengths of their political system. In the United Kingdom, for example, 58%
of those ages 50 and older think this, compared with 44% of those ages 30 to
49 and only 29% of those under 30. In every
country surveyed, people who think the economy is in good shape are also more
likely to say their system is effectively handling the coronavirus pandemic
in ways that show their political strengths than those who think the economy
is in bad shape. Most see vaccines as at least somewhat important for being
a good citizen Around
two-thirds or more in every country surveyed say it’s at least somewhat
important to get a coronavirus vaccine to be a good member of society. But,
the share that describes it as very important
varies substantially across the 19 nations, from around seven- in-ten who
feel this way in Singapore, Sweden and Spain to around four-in-ten or fewer
in France, South Korea, Hungary and Poland. Across the
19 countries surveyed, there is a positive relationship between the share of
the public who think it’s very important to get a vaccine to be a good member
of society and the actual population that was fully or partially vaccinated
at the time that fieldwork began (r=0.64). In almost
every country, those ages 50 and older are more likely to say it’s crucial to
be vaccinated to be a good member of society than younger people – especially
those under 30. Opinion across age groups often varies widely, too. In South
Korea, for example, 54% of those 50 and older think it is very important,
compared with around a third of those ages 30 to 49 and about one-in-five of
younger adults. Partisan
preferences also play a strong role in whether people think vaccination is
crucial to be good members of society. In every nation, those who support the
party or parties who are currently governing are much more likely to say it
is very important to be vaccinated than those who do not support the ruling
parties. This difference is largest in the U.S., where 64% of Democrats and
Democratic-leaning independents think vaccines are very important, compared
with 20% of Republicans and Republican-leaning independents. There are
also large ideological differences in nearly every country where left-right
ideology is asked. In the U.S., South Korea, Canada, Italy, Israel, Spain,
the Netherlands and Germany, those who place themselves on the left are more
likely to call vaccination very important for being a good citizen than those
on the right; however, the opposite is true in Hungary, Poland, France and
Greece. In the U.S., again, the differences between people on either side of
the ideological spectrum is greater than in any other country surveyed (46 percentage
points). In some
cases, right-wing populist party supporters are less likely than
nonsupporters to say it is very important to get a vaccine. For instance,
only 24% of Germans with a favorable view of Alternative for Germany (AfD)
say vaccination is very important, while 64% of those with an unfavorable
view say getting a vaccine is very important. (PEW) AUGUST 11,
2022 755-43-22/Polls A Median Of 70% Of Adults Across 19 Countries Say
They Will Be Worse Off Than Their Parents
When asked
how children in their country will fare financially when they grow up, a
median of 70% of adults across 19 countries say they will be worse off than
their parents, according to a Pew Research Center survey conducted this
spring. At least
three-quarters of adults in Japan, France, Italy and Canada say children will
be worse off financially than their parents, as do majorities in Spain, the
United Kingdom, Australia, the United States, Belgium, Greece, the
Netherlands and South Korea. Singapore is the lone country surveyed where a
majority of adults (56%) believe the next generation will be better off financially. In Israel,
Hungary and Poland – where the surveys were conducted through face-to-face
interviews – more than one-in-ten volunteered a response of “same,” meaning
they believe children will have about the same financial situation as their
parents. Still, Hungarians are more pessimistic than optimistic about the
financial future of children in their country, while Israelis are more
optimistic and Poles are almost evenly split. In nine of
the countries surveyed, the percentage of people who say children are going
to be worse off than their parents has increased significantly since the
question was last asked. For example, 42% of respondents in Poland say the
youngest generation will be worse off financially – nearly double the 23% who
said so in 2019. The
proportion of people with a pessimistic view of children’s financial future
is up by 14 percentage points in Australia, 12 points in the Netherlands and
11 points in Hungary since the last time the question was asked in each
country. Smaller but still significant increases in these views occurred in
the UK, Canada, Singapore, Japan and the U.S. In 11 of the
countries surveyed this year, a record or near record high percentage of
adults say children will be worse off financially than their parents. In
South Korea, for example, there has been a steady increase since the question
was first asked in 2013 in the share of adults who say children will be worse
off than their parents. In other
countries, however, the share of adults who see a worse financial future for
children is lower than in previous years. In France, for example, 90% of
adults said in 2013 – during the eurozone public debt crisis which resulted
in a French
recession – that children would be financially worse off than their
parents. In all 19
countries surveyed, people with a negative view of their country’s current
economic conditions are far more likely to believe that children in their
country will be worse off in the future. In Poland, for example, 63% of those
with a negative view of the country’s current economic situation believe
children will be worse off in the future. Among Polish adults who see the
country’s current economic situation as good, by contrast, only 19% share
this view. Even in Japan, where the difference is the smallest of 19
countries, the gap stands at 17 points. Even among
those with a positive view of their country’s current economy, however, many
are pessimistic about the financial prospects of the next generation. In 10
countries – the U.S., Italy, the UK, Spain, the Netherlands, Australia,
Canada, France, Belgium and Japan – around half or more of adults with a
positive view of the economy nevertheless expect children to be worse off
than their parents. (PEW) AUGUST 11,
2022 755-43-23/Polls Slightly More Than 2 In 3 (68%) People, On Average,
Across 31 Countries Said They Were Concerned About The Impacts Of Climate
Change
It feels
like the world’s on fire (both literally and figuratively) these days. Heat waves
have pummeled people around the globe in 2022, from India and Pakistan this
spring to the U.K., France and beyond this summer. There’s been wildfires and
deaths linked to the record-setting temperatures. Alongside
these seemingly unrelenting weather events, the world is still battling the
COVID-19 pandemic as well as soaring inflation. Attention is divided. But in late
July, the United Nations’ Secretary General put the spotlight squarely back
on what he called a “climate emergency” and warned “half of humanity is in
the danger zone, from floods, droughts, extreme storms and wildfires.” Here's what
Ipsos’ Global
Advisor polling has uncovered about people’s attitudes related to
climate change this year so far.. 1. Spreading concern. Slightly more than
2 in 3 (68%) people, on average, across 31 countries said they were concerned
about the impacts of climate change that were already being seen in their
country in an
online poll conducted this spring. 2. Fueling action. Polling from Ipsos
with the World Economic Forum found people want their country to take action. The vast majority
(84%) of those surveyed, on average, across 30 countries said it’s very, or
somewhat, important to them that their country shifts away from fossil fuels
to more climate-friendly and sustainable energy sources over the next five
years. 3. Chewing on change. About 2 in 5 people said they’re likely to eat less
meat, or replace the meat in some meals with alternatives such as beans, in a
bid to limit their own contribution to climate change in 2022.
4. We’re all in this together. The
majority of respondents across 31 countries, on average, tended to
agree businesses, governments and individuals will all be failing
people if they don’t act now to combat climate change.
5. Inflation looms large. Despite
headline-grabbing heat waves and wildfires this year, economic
issues are grabbing more attention. While climate change and threats
against the environment are worrying, inflation has been seen as the top
concern around the world for four months in a row.
(Ipsos MORI) 10 August
2022 Source: https://www.ipsos.com/en-uk/data-dive-how-people-feel-about-climate-change-and-what-do-about-it |


