|
BUSINESS & POLITICS IN THE WORLD GLOBAL OPINION REPORT NO. 711-712 Week:
October 04 –October 17, 2021 Presentation:
October 22, 2021 Record
196,000 Students Cut Class In Japan During Fy2020 During Covid-19 Crisis More
Than Half 51% Of Urban Indians Think This Is A Good Time To Invest In Real
Estate Anxiety
Of Parents Increased To 46% In Face-To-Face Education In
Expo 2020 Dubai, An Average Of 42% Respondents Agreed These Brands Fit Well
With The Event The
Conservatives Have Now Dropped To 41% In Red Wall Vote Intention More
People Are Unconfident In The Police (48%) Than Confident (43%) Two
Thirds Of Britons (63%) Know Someone Who Has A Mental Health Problem Nearly
Three In Ten Men (28%) And One In Five Women (18%) Have Misconceptions About
Mental Health Government's
Covid-19 Charity Support Fund Delivers Hope To 6.5 Million People Across
Country 18%
Of The Britons Use Streaming Services As A Way To Follow Live Sport The
Liberal Democrats Are Only Currently Holding On To Half Of Their 2019 Voters
(51%) Two
In Five Brits (40%) Say They Have The NHS COVID-19 App Installed On Their
Phones Most
French People Have An Aperitif With Their Family (56%) Rising
Share of U S Adults Are Living Without a Spouse or Partner Two-Thirds
Of U S Catholics Unaware Of Pope’s New Restrictions On Traditional Latin Mass States
Have Mandated Vaccinations Since Long Before Covid-19 Nine
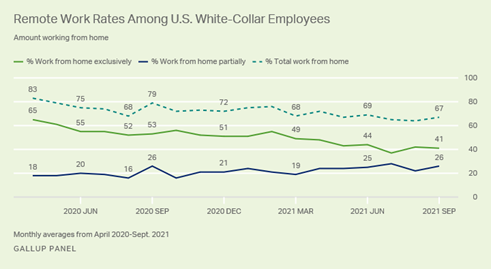
In 10 Remote Workers Want To Maintain Remote Work To Some Degree Pandemic
Within A Pandemic: Most (69%) Believe There Is A Mental Health Pandemic In
Canada Sydney
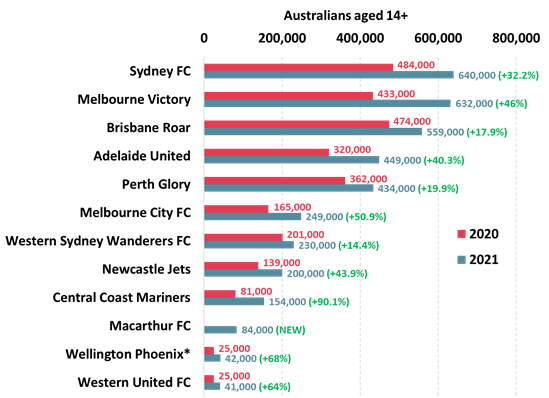
FC Is The Most Widely Supported A-League Club As Support Rises For The League
Overall Support
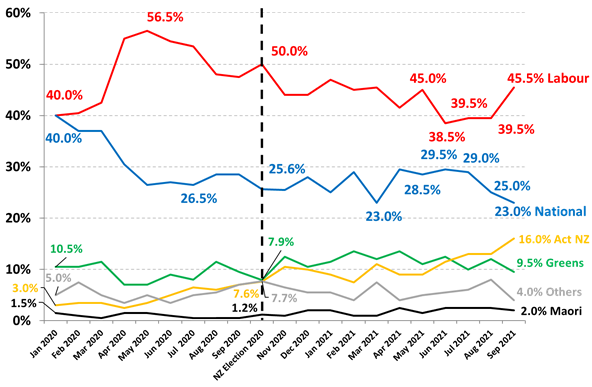
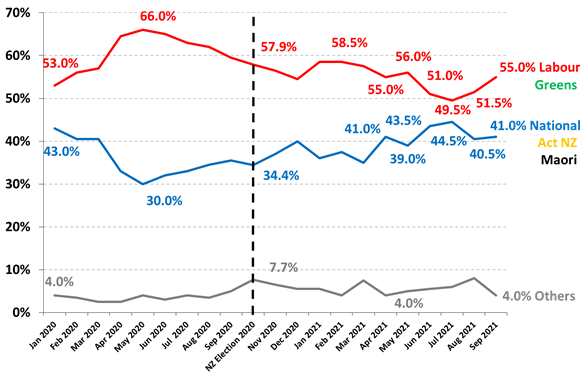
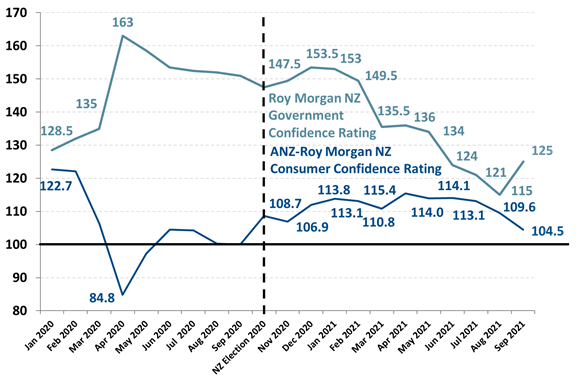
For New Zealand’s Labour/Greens Government Increased 3.5% Points To 55% In
September A
Global Country Average Of 64% Rate Doctors As Trustworthy Diversity
And Division In Advanced Economies INTRODUCTORY NOTE
711-712-43-44/Commentary:
About
8 In 10 Nigerians (76 Percent) Especially In The North-East (93 Percent) Zone
Believe That Nigeria Is Better As A Nation
Abuja, Nigeria.28th September 2021. A new public
opinion poll conducted by NOIPolls has revealed that about 8 in 10 Nigerians
(76 percent) especially in the North-East (93 percent) zone believe that
Nigeria is better as a nation, although a considerable proportion 24 percent
especially from the South-East zone (62 percent) think otherwise. Further
findings showed that 77 per cent of the respondents disclosed that they are
proud to be Nigerians. However, this stance varied across the geo-political
zones, where the highest figure was recorded in the North-East (89 percent)
and North-West zone (87 percent) and the lowest obtained in the South-East
(48 percent) and South-West (67 percent) zones respectively. Moreover,
the greatest achievements of Nigeria at 61 years were perceived to be Unity
(17 percent), Democracy (14 percent), Agricultural development (8 percent),
and telecommunications (8 percent). On the contrary, it is instructive to
note that 36 percent of respondents felt Nigeria has achieved nothing in 61
years of its independence and this assertion is predominant amongst Nigerians
residing in the South-East (64 percent), South-West (50 percent), and
North-Central (46 percent). Finally,
while there have been recent agitations for the breakup of Nigeria, poll
results reveal clearly that the breakup agenda cannot be sustained as the
overwhelming proportion of Nigerians are proud to be Nigerians. For
sustenance of this embedded pride in the Nation, there is a need for
government to create and nurture a culture of inclusive governance with a
two-way symbiotic relationship between the government and the Nigerian
citizens. This will significantly raise eagerness and participation towards
governance, while enhancing the common pursuit of national development for
the good of the Nigerian populace, thus automatically reinforcing the feeling
of patriotism and pride in the nation. These are some of the key findings
from the Independence
Day Poll conducted in the week commencing September 6th, 2021. Survey
Background For one,
citizenship embodies the rights and duties of citizens, for another,
citizenship is also ‘essential for cultivating civic virtues and democratic
values.[1] Whereas
there can be no citizens without states, ‘states without citizens’[2] exist
where the state falters on almost all its salient responsibilities, forcing
the ‘citizens’ to resort to alternative coping strategies, including
resorting to self-help strategies. The denial of full citizenship to
individuals or groups for whatever reasons as this scenario depicts, is
usually accompanied by a drastic fall in citizens’ level of nationalism,
participation, and trust in political institutions and political class. Any citizen
or group of citizens who feel genuinely alienated, marginalized, or
discriminated against by the political system may not be sufficiently
inspired to publicly proclaim or assert their citizenship of such a political
system. For such a group of people, political independence counts for little
since it could not offer them adequate protection in terms of rights,
participation, and identity. There is a sense in which it can be argued that
the nationalists who fought colonialism, nurtured expectations that political
independence would offer a sustainable path to redemption, including the
citizenship question. But as it has turned out, the initial hope of
independence has been squandered under successive military regimes. The struggle
to reclaim hope led to what some have labelled the second independence
movement[3],
embodied by the largescale movements in the late 1980s and early 1990s for
democratization. While the battle was partially won with the return to a
democratic civil regime in 1999, the crises and contradictions of the
democratization process have also dampened the high expectations that
attended the return to democracy. There is,
therefore, a new phase of the independence movement concerned mainly with the
pressure of good governance, one that can deliver the dividends of democracy
to its citizens. It is only within such a democratic order[4],
predicated upon popular legitimacy, transparency, accountability, and
effective service delivery that the notions of citizenship and independence
assume any useful meaning. Against the background, NOIPolls conducted a
public opinion poll to assess the perceptions of Nigerians on citizenship,
patriotism, and Nigeria’s independence, which are very critical to any
nation-state project. Survey
Findings Nationalism
is an essential component of statehood. It generally represents the deep
feelings of attachment and belonging in citizens that inspire supportive
attitudes and behaviours towards nationalistic symbols. One way of expressing
this is the pride of being a citizen of a country. When asked whether they
were proud to be Nigerians or not, it is gratifying to note that an
overwhelming majority answered in the affirmative. Overall, 77 percent of the
respondents said they were proud to be Nigerians, while 23 percent felt
otherwise. This is gratifying, especially in the face of ongoing agitation
for secession and other critical challenges to the corporate existence of the
country. Further
analysis by geographical revealed that the least expression of pride in being
a Nigerian was seen in the South-East region (48 percent) followed by the
South-West (67 percent), whereas the highest level of patriotism was
witnessed in the North-East (89 percent) and North-West (87 percent).
Trend
analysis revealed a consistent drop in the level of patriotism from 2013 to
2021 and an 8 percent decrease when current findings are compared with
results obtained in 2019.
Subsequently,
when asked what they love most about being a Nigeria, 35 percent mentioned
cultural diversities, 24 percent said unity and 22 percent stated that they
don’t love anything about being a Nigerian.
When
respondents were asked about Nigeria’s founding fathers or past leaders that
inspire them the most, the result showed that Umaru Ya’radua (21 percent) and
Goodluck Jonathan (19 percent) were Nigeria’s past leaders that inspired
Nigerians the most. Other names mentioned are Olusegun Obasanjo (8 percent),
Late Dr Nnamdi Azikiwe (7 percent) and Late Sir Abubakar Tafawa Balewa (6
percent) amongst other founding fathers and past leaders.
Furthermore,
Security (40 percent), Economy (17 percent), and Job creation (12 percent)
have been identified as the top three issues Nigeria as a nation needs to
address within one year. Other mentions include corruption (7 percent),
poverty (5 percent), electricity supply (5 percent), and education (4 percent)
amongst other issues stated.
In the
assessment of respondents, the greatest achievements of Nigeria in its 61
years of political independence since 1960 include Unity,
democracy, agricultural development, and telecommunications. The chart
below reveals the following proportion of respondents; 17 percent, 14
percent, 8 percent, and 8 percent opted for these accomplishments
respectively. On the
contrary, it is instructive to note that 36 percent of respondents felt
Nigeria has achieved nothing in 61 years of its independence and this
assertion is predominant amongst Nigerians residing in the South-East (64
percent), South-West (50 percent), and North-Central (46 percent).
When asked
whether they feel they can and are free to live and do business in any part
of Nigeria, the poll findings revealed that 53 percent of the respondents
answered in the affirmative. However, it is worrisome to note that a sizeable
number of the respondents (47 percent) thought otherwise. Geopolitically,
there are variations in being able to and free to live and do business in any
part of Nigeria. Concerning those who said yes, which has nationwide support
of 53 percent of the respondents, the South-South and the North-Central fared
better than the national rating at 65 percent and 57 percent respectively. On
the other hand, the North-East, North-West, South-East and South-West fell
below the national score with 47 percent, 52 percent, 46 percent, and 49
percent of the respondents respectively.
When
respondents were asked whether Nigeria is better as a nation or being
divided, it is worthy to note that an overwhelming majority answered in the
affirmative. Overall, 76 percent of the respondents said that Nigeria is
better as a nation, while 24 percent felt otherwise. This is gratifying,
especially in the face of ongoing agitation for secession and other critical
challenges to the corporate existence of the country. More
findings across social categories revealed some variations in terms of
gender, geographical locations, and age distribution. For instance, while the
North-East region had more respondents who stated that Nigeria is better as a
nation, the South-East zone had the lowest number of respondents who asserted
this perspective.
Respondents
were further probed, and the poll revealed that those who stated that Nigeria
is better as a nation gave reasons such as ‘we can achieve more together’ (39
percent), ‘division will cause more harm’ (28 percent), ‘Nigeria is better as
a nation ‘ (15 percent), and ‘we need restructuring not division’ (10
percent) amongst other reasons. On the other
hand, ‘too much sentiment and tribalism’ (36 percent), ‘some regions are
being marginalized’ (32 percent), ‘division will bring peace’ (15 percent),
and ‘bad government’ (9 percent) amongst other reasons.
Conclusion In
conclusion, the results have revealed that most Nigerians are proud to be
Nigerians and a sizeable proportion (77 percent) of the respondents
especially in the North-East (93 percent) zone believe that Nigeria is better
as a nation. Therefore, for the sustenance of this embedded pride in the
Nation, there is a need for government to create and nurture a culture of
inclusive governance with a two-way symbiotic relationship between the
government and the Nigerian citizens. This will significantly raise eagerness
and participation towards governance, while enhancing the common pursuit of
national development for the good of the Nigerian populace, thus
automatically reinforcing the feeling of patriotism and pride in the nation. Finally,
more efforts should be made to foster a sense of national belonging, unity,
and integration. As this poll reveals, responses tended to follow a certain
geopolitical pattern that suggests a great deal of discontent across regions.
Paying more attention to the ongoing debate about political restructuring is
potentially one of the ways by which the problem can be addressed. (NOI Polls) October 5,
2021 Source: https://noi-polls.com/independence-day-poll-report-2/ 711-712-43-45/Country Profile:
711-712-43-46/Commentary: Death
Survey Findings On Value Of Life: Religious Britons Found More Egalitarian On
Value Of Life Than Ir-Religious
In January a
former Supreme Court judge and civil liberties campaigner Lord Sumption
sparked controversy when
he claimed that ‘all lives are not of equal value’. The YouGov Death Study
shows what Britons think about the value of human life. While a vast
majority (73%) say all human lives are equally valuable, one in five (20%)
think this is not the case. More men (23%) than women (17%) think that not
all human lives are equally valuable. The YouGov
Death Study finds that the less religious a person is, the more likely they
are to believe that all lives do not have equal value. Among religious
Britons who actively practice their faith, eight in ten (82%) think that the
lives of all humans are equally valuable, with 12% disagreeing. Three
quarters (75%) of Britons who are not practicing their religion say that all
human lives are worth the same, while 20% of them disagree. Of the Britons
who do not belong to any particular religion, 69% say all human lives have
equal value, but a quarter (24%) think they do not.
How many people have wished death on someone? A third of
Britons (32%) report they have seriously wished death upon someone. While 8%
regret it, a quarter (24%) don’t. A third of men (36%) wished death on
someone, compared to about three in ten (28%) women. Among
Britons who actively practice their religion, a quarter (26%) say they have
sincerely wished for someone to die, with more of those who say they don’t
regret it (15%) than those who do (11%).
Is it ok to be pleased that someone has died? YouGov
research reveals that over half of Britons (56%) think it can be acceptable
to celebrate someone’s death, while 23% say that can never be the case. Men (61%)
are likelier than women (51%) to think it is ok to rejoice over somebody’s
death. Men aged 16-24 are significantly more likely than all other
Britons (71% vs 43-60%) to think it is ok to cheer someone’s demise. (YouGov UK) October 06,
2021 711-712-43-47/Country Profile:
SUMMARY
OF POLLS
ASIA (Japan) Record
196,000 Students Cut Class In Japan During Fy2020 During Covid-19 Crisis A record 196,127 elementary and junior high
school students skipped classes for reasons other than illness, financial
circumstances and precautions against infections in fiscal 2020, according to
a survey by the education ministry. National Police Agency data shows 507
elementary, junior high and senior high school students, including those
whose cause of death has yet to be officially determined, took their own
lives in fiscal 2020. (Asahi Shimbun) October 14, 2021 (India) More
Than Half 51% Of Urban Indians Think This Is A Good Time To Invest In Real
Estate As Diwali is believed to be an auspicious
period to make investments in property, YouGov’s new research examines
factors such as attitudes, purchase intent and reasons that urban Indians
consider before making real estate purchase. Data suggests that more than
half (51%) of urban Indians agree with the statement - “This is a good time to invest in real estate in
India”, which is a positive sign for real estate companies and
property dealers. Only one in eight (12%) disagree, while 27% remain
undecided. (YouGov India) October 6, 2021 (Turkey) Anxiety
Of Parents Increased To 46% In Face-To-Face Education In the first week when schools opened,
parents were not very positive about the measures taken at schools, but the
rate of parents who thought that the measures were sufficient was higher than
those who thought that the measures were insufficient. However, when it comes
to today, 39% of the parents find the measures sufficient, while half of them
think that the measures taken are insufficient. (Ipsos Turkey) 4 October 2021 MENA (Dubai) In
Expo 2020 Dubai, An Average Of 42% Respondents Agreed These Brands Fit Well
With The Event In September, ahead of the launch ceremony,
aided sponsorship awareness averaged 39% across the 31 Dubai partner brands
among respondents familiar with the brands. Emirates registered the highest
awareness (at 64%), followed by Etisalat (also at 64%), Dubai Chamber (57%),
Emirates NBD (56%) and Emaar Hospitality (55%). (YouGov MENA) October 11, 2021 AFRICA (Nigeria) About
8 In 10 Nigerians (76 Percent) Especially In The North-East (93 Percent) Zone
Believe That Nigeria Is Better As A Nation A new public opinion poll conducted by
NOIPolls has revealed that about 8 in 10 Nigerians (76 percent) especially in
the North-East (93 percent) zone believe that Nigeria is better as a nation,
although a considerable proportion 24 percent especially from the South-East
zone (62 percent) think otherwise. Further findings showed that 77 per cent
of the respondents disclosed that they are proud to be Nigerians. (NOI Polls) October 5, 2021 (South
Africa) More
Than Half (55%) Of South Africans Believe That “Most” Or “All” Police
Officials Are Involved In Corruption Only one-fourth (26%) of South Africans say
they trust the police “somewhat” or “a lot” – about half as many as in 2011 (49%).
Distrust of the police is at its highest level of the past two decades, with
73% of citizens saying they trust them “just a little” or “not at all.” The
police trail other public institutions in popular trust, including the army
(53% “somewhat” or “a lot”), the courts (43%), and the president (38%). (Afrobarometer) 8 October 2021 WEST
EUROPE (UK) The
Conservatives Have Now Dropped To 41% In Red Wall Vote Intention YouGov data shows the Conservatives and
Labour neck and neck in
the so called ‘Red Wall’ of pivotal Northern, Midlands, and North Wales
constituencies. According to our MRP model, estimated using almost 10,000
respondents, the Conservatives have now dropped to 41% in Red Wall vote
intention. That’s seven points down on 2019, and two points below their 2017
showing under Theresa May. (YouGov UK) October 04, 2021 More
People Are Unconfident In The Police (48%) Than Confident (43%) YouGov routinely asks the British public
their confidence in the police to deal with crime in their local area, and
for the first time since we started asking in July 2019 more people are now
unconfident in the police (48%) than confident (43%). This is a stark
decrease of 10 points since late February/early March, when 53% had a
lot/fair amount of confidence and 40% had not very much or none. However,
between that survey and one at the end of the month – a period which
coincided with Sarah Everard’s murder – these figures narrowed, and had
remained at that level until deteriorating further this month. (YouGov UK) October 06, 2021 Death
Survey Findings On Value Of Life: Religious Britons Found More Egalitarian On
Value Of Life Than Ir-Religious The YouGov Death Study finds that the less
religious a person is, the more likely they are to believe that all lives do
not have equal value. Among religious Britons who actively practice their
faith, eight in ten (82%) think that the lives of all humans are equally
valuable, with 12% disagreeing. Three quarters (75%) of Britons who are not
practicing their religion say that all human lives are worth the same, while
20% of them disagree. Of the Britons who do not belong to any particular
religion, 69% say all human lives have equal value, but a quarter (24%) think
they do not. (YouGov UK) October 06, 2021 Britons
Think The Government Are Handling Taxes Badly (60%), With Just 25% Saying
They’re Doing A Good Job As a result of the poorly-received changes to National
Insurance,
Britons also think the government are handling taxes badly (60%), with just
25% saying they’re doing a good job. Chancellor Rishi Sunak has refused to
rule out further tax rises in the near future, suggesting that the Conservatives’
problems in this area are unlikely to abate any time soon. By 58% to 10%
Britons think the economy remains in a bad state, only a slight improvement
compared to March when the country was still in lockdown. (YouGov UK) October 07, 2021 The
Majority (57%) Of The Public Oppose Protesters Being Given Prison Sentences
For Blocking Motorways, Although A Third (34%) Would Support Such A
Punishment Just 18% of Brits now support the actions,
compared to a quarter (25%) who backed the group three weeks ago. Even
amongst people who listed the environment as one of the most important issues
facing the country, opposition to the protesters now substantially outweighs
support. Most of this group (58%) oppose the protesters’ actions, compared to
just a third (33%) who support them. (YouGov UK) October 08, 2021 Two
Thirds Of Britons (63%) Know Someone Who Has A Mental Health Problem A third of Britons say they have a family
member with mental health issues, 29% say a friend suffers and 15% list
another acquaintance who does too. Only a quarter of Britons (25%) say they
don’t know anyone with mental health problems, with the rest responding
either ‘don’t know’ to the question premise (5%) or that they would prefer
not to answer (7%). The older Britons are, the less likely they are to say
they know anyone with mental health problems, or to suffer from them
themselves. (YouGov UK) October 10, 2021 Nearly Three In Ten Men (28%) And One In
Five Women (18%) Have Misconceptions About Mental Health Men – who overwhelmingly tend to dominate senior management roles – are much more prone than women to
say it’s ‘probably’ or ‘definitely’ true that people with mental health
issues can’t work or will under-perform. Nearly three in ten men (28%)
believe this, compared with one in five women (18%). In fact, most people with mental health issues can be as productive as those not suffering
from poor mental health. Men are likewise nearly twice as likely as women to
believe that “rich people with mental health issues lack perspective and
don’t know what real problems are” at 23% to 12%. (YouGov UK) October 10, 2021 Three
Quarters Of Britons (77%) Say Society Should Consider Mental And Physical
Illnesses As Equally Important With World Mental Health Day approaching, a
day aiming to remove the stigma around mental health issues, a new YouGov
survey shows that three quarters of Britons (77%) say society should consider
mental and physical illnesses as equally important. Only 11% admit to wanting
physical conditions to take priority, and one in twenty (5%) say mental
health issues should come first. (YouGov UK) October 10, 2021 Government's
Covid-19 Charity Support Fund Delivers Hope To 6.5 Million People Across
Country The Minister for Civil Society has hailed
small charities as 'the backbone of our communities', as an impact report
published today reveals that 8,200 organisations have supported an estimated
6.5 million people during the COVID-19 pandemic, thanks to £200 million in
bespoke Government funding, distributed by The National Lottery Community
Fund (NLCF). This included children and young people (supported by 39% of
grantholders), people with mental health conditions (40%) and older people
(32%). (Ipsos MORI) 11 October 2021 18%
Of The Britons Use Streaming Services As A Way To Follow Live Sport When BT Sport was originally launched in
2013, it was made available free to BT’s broadband customers and widely
perceived as a way of shoring up the parent company’s lucrative position as
an internet provider. And indeed, if we look at BT Broadband’s customer base
today, you can see that current customers of BT Sport (defined as those who
have watched the channels in the past 30 days) are more than twice as likely
to be a BT Broadband customer as those who are not (35.8% vs 17.5%). (YouGov UK) October 12, 2021 Half
Of The UK (47%) Say They Would Support The Government Adding A 'Green Tax' To
Environmentally Damaging Goods Half of the UK (47%) say they would support
the government adding a 'green tax' to environmentally damaging goods and
two-thirds (65%) think the government should make it compulsory for all
products to include labelling on their environmental impact. Further, there
is no majority opinion on whether dealing with climate change should be
prioritised at the cost of the economy (40%), or if economic growth should be
the focus at the expense of the environment (34%). (Ipsos MORI) 13 October 2021 A
Third Of Britons (35%) Deem Alcohol ‘Very Harmful’ To The User, While About
Half (47%) Believe The Same About Its Costs To Society Britons tend to view legal substances such
as tobacco and alcohol as more harmful to the user and society in general
than laughing gas. Around half of the public say tobacco is ‘very harmful’ to
people who consume it regularly (53%) and in terms of the wider cost to
society (47%). Similarly, about a third of Britons (35%) deem alcohol ‘very
harmful’ to the user, while about half (47%) believe the same about its costs
to society. (YouGov UK) October 13, 2021 Latest REACT-1 Study Findings Show SARS-COV-2 Infection
Rates Were Rising In Young People But Remaining Stable Overall Over 100,000 volunteers took part in the
study in England between 9 and 27 September 2021 to examine the levels of
COVID-19 in the general population. The latest data show that prevalence of
SARS-CoV-2 (the virus that causes COVID-19) in the population in England has
increased to 0.83%. The report found 764 positives from 100,527 swabs giving
a weighted prevalence of 0.83%. However, there was some variation between age
groups. Prevalence was growing in those aged 17 years and below with an R
number of 1.18, while prevalence was decreasing in those aged 18-54 years
with an R number of 0.81. (Ipsos MORI) 14 October 2021 The
Liberal Democrats Are Only Currently Holding On To Half Of Their 2019 Voters
(51%) Both major parties are holding onto the
large majority of their 2019 voters – the Conservatives are retaining 83% of
those who voted for them last time, while for Labour it is 77%. Very few voters
are switching between the two parties, with just 3% of 2019 Labour voters
saying they now favour the Conservatives, and 5% going the opposite way. The
biggest drain on the 2019 Labour vote is from the Greens, who are currently
attracting one in nine (11%) of this group. (YouGov UK) October 15, 2021 Two In Five Brits (40%) Say They Have The NHS COVID-19 App
Installed On Their Phones Currently, two in five Brits (40%) say they
have the app installed on their phones, down from 47% in mid-July. Approaching
a fifth of the general public have deleted the app from their phones (19%).
This means that almost a third of people who have ever had the app have now
deleted it, almost twice the rate it was in July. Younger Britons (18-24-year-olds) are the most likely to have
done away with the app: 29% have done so, compared to 13% of those aged 65
and above. (YouGov UK) October 15, 2021 (French) Most
French People Have An Aperitif With Their Family (56%) The aperitif is a moment of sharing
particularly appreciated by the French. Indeed, 74% of them say they take an
aperitif at least once a month ,
and 49% at least once a week. The 25-34 year olds seem to be the greatest
followers: 57% say they take an aperitif at least once a week (significantly
more than the national population). Most French people have an aperitif with their family (56%) . In
addition, 46% are used to doing it with friends, 40% with their partner and
8% with colleagues. It should also be noted that more than one in ten
people are used to having an aperitif alone (12%). (YouGov France) October 13, 2021 NORTH AMERICA (USA) About Eight-In-Ten US Hispanics (81%) Say Addressing Global
Climate Change Is Either A Top Concern Or One Of Several Important Concerns
To Them Personally About eight-in-ten U.S. Hispanics (81%) say
addressing global climate change is either a top concern or one of several
important concerns to them personally, with 39% saying it is a top personal
concern. By comparison, a lower share of non-Hispanics (67%) say addressing
global climate change is at least one of several important concerns, due in
large part to a lower share who say it is a top concern (29%). In addition, a
greater share of non-Hispanics than Hispanics say addressing global climate
change is not an important
concern to them (32% vs. 18%). (PEW) OCTOBER 4, 2021 Rising Share of U S Adults Are Living Without a Spouse or
Partner As relationships, living arrangements and family life continue to evolve for American
adults, a rising share are not living with a romantic partner. A new Pew
Research Center analysis of census data finds that in 2019, roughly
four-in-ten adults ages 25 to 54 (38%) were unpartnered – that is, neither
married nor living with a partner.1 This share is up sharply from 29% in
1990.2 Men are now more likely than women to
be unpartnered, which wasn’t the case 30 years ago. (PEW) OCTOBER 5, 2021 Two-Thirds Of Republicans Want Trump To Retain Major
Political Role; 44% Want Him To Run Again In 2024 About one-in-five Republicans (22%) say
that while they would like Trump to continue to be a major political figure
in the United States, they would prefer he use his stature to support another
presidential candidate who shares his views in the 2024 election rather than
run for office himself. About a third of Republicans (32%) say they
would not like Trump
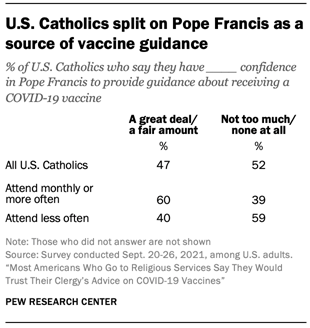
to remain a national political figure for many years to come. (PEW) OCTOBER 6, 2021 Two-Thirds Of U S Catholics Unaware Of Pope’s New
Restrictions On Traditional Latin Mass Overall, 65% of U.S. Catholics say they
have heard “nothing at all” about the pope’s decision to impose new limits on
the use of the traditional Latin Mass. About three-in-ten of those surveyed
(28%) have heard “a little” about the change, and 7% say they have heard “a
lot” about it. All the survey respondents who indicated they have heard at
least a little about the new limitations received a follow-up question asking
whether they approve or disapprove of the pope’s decision. Their opinions are
divided about evenly between those who approve (9% of all Catholics) and
those who disapprove (12% of all Catholics) of Francis’ actions. (PEW) OCTOBER 7, 2021 States Have Mandated Vaccinations Since Long Before
Covid-19 Of the 16 immunizations the CDC recommends
for children and teens, all 50 states (plus the District of Columbia) mandate
diphtheria, tetanus, pertussis (whooping cough), polio, measles, rubella and
chickenpox. In addition, every state except Iowa mandates immunization
against mumps. (The diphtheria, tetanus and pertussis vaccines usually are
given as a single combined shot, as are the measles, mumps and rubella
vaccines.) Except for the chickenpox vaccine, which became available in the
United States in 1995, all those vaccines have been around for 50 years or
more. (PEW) OCTOBER 8, 2021 The 2020 Census Counted 126.8 Million Occupied Households,
Representing 9% Growth Over The 116.7 Million Households Counted In The 2010
Census The 2020 census counted 126.8 million
occupied households, representing 9% growth over the 116.7 million households
counted in the 2010 census. That single-digit growth was more anemic than the
prior record low percentage growth of households (11%) during the previous
decade, as shown in the 2010 census. The decennial census has counted the
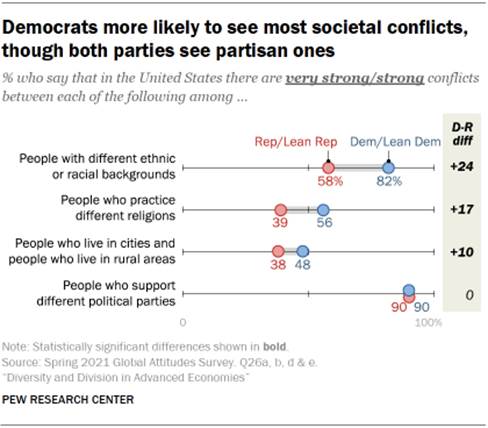
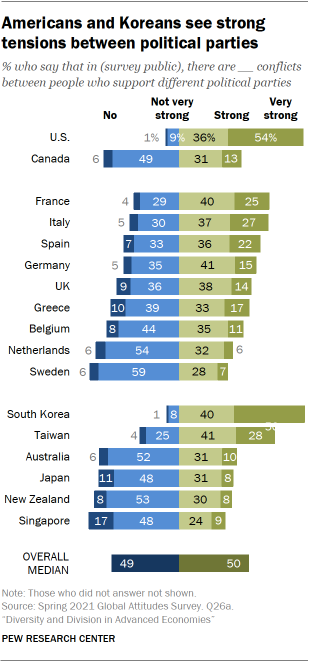
number of U.S. households on a consistent basis dating back to 1850. (PEW) OCTOBER 12, 2021 Nine-In-Ten U S Adults Say There Are Conflicts Between
People Who Support Different Political Parties In the U.S., there are large political
divisions on most of the measures of societal conflict. Democrats and
Democratic-leaning independents are significantly more likely than
Republicans and Republican-leaning independents to say there are conflicts on
each of the items surveyed, with one exception: An equal share (90%) of partisans
on both sides say there are strong or very strong conflicts between people
who support different political parties. (PEW) OCTOBER 13, 2021 Nine In 10 Remote Workers Want To Maintain Remote Work To
Some Degree Forty-five percent of full-time U.S. employees
worked from home either all (25%) or part of the time (20%) in Gallup's
September update of its monthly employment trends. These figures are
unchanged from remote working rates in July and August, signaling that U.S.
companies' return-to-office plans remain on hold. Most recently, 25% worked
exclusively from home, and 20% worked some of the time from home, for a total
of 45% working remotely. (Gallup) OCTOBER 13, 2021 67% Of Americans Perceive A Rise In Extreme Weather, But
Partisans Differ Over Government Efforts To Address It Nearly three-quarters of U.S. adults (73%)
in the West South Central census division – an area hit hard by Tropical Storm
Nicholas and Hurricane Ida – say they’ve experienced extreme weather within
the past year. A majority of adults (59%) say the same in the Mid-Atlantic
region, which was affected by recent heavy rains associated with Ida. By
contrast, far fewer say they’ve experienced extreme weather in other regions
over the past year, including in the South Atlantic (34%) and East North
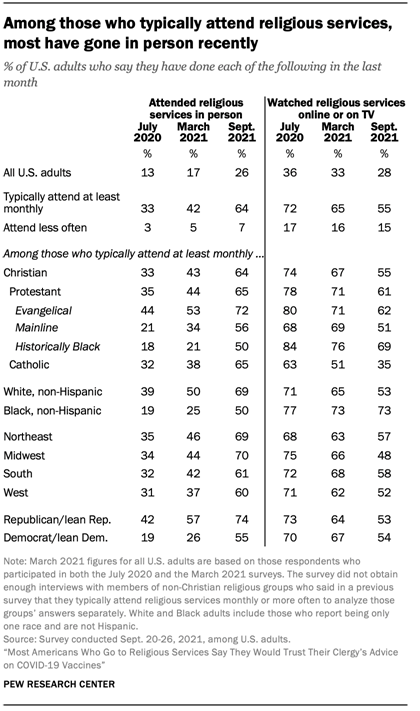
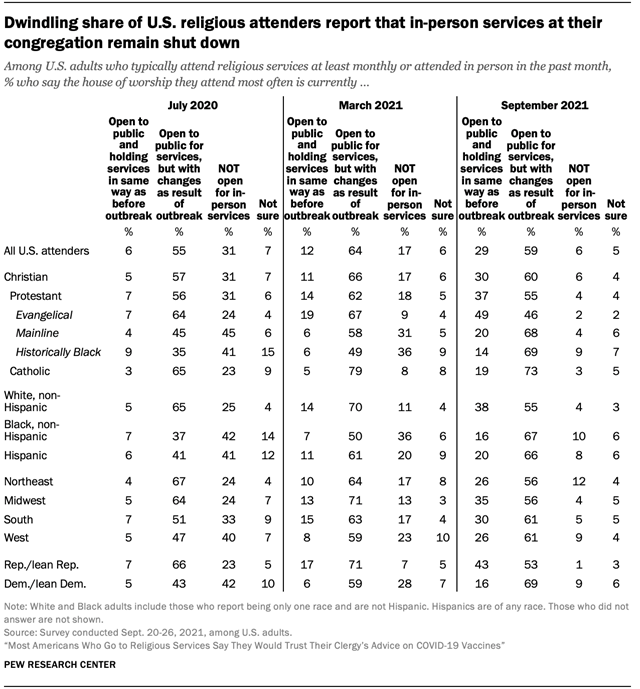
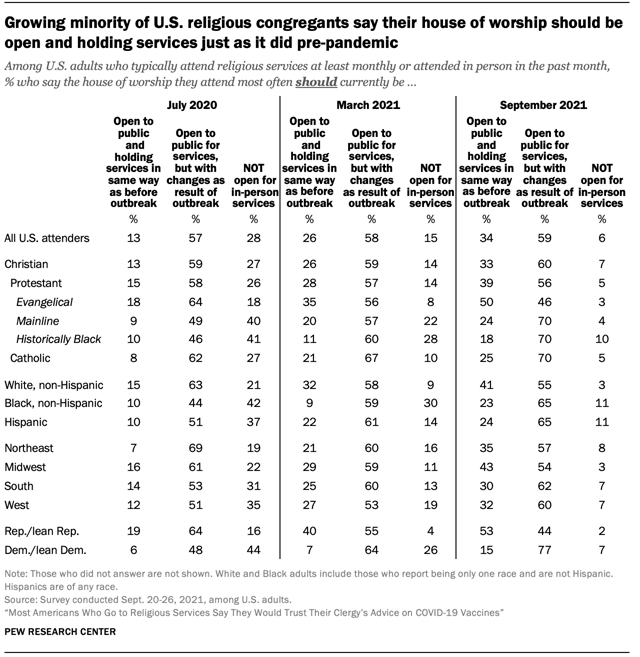
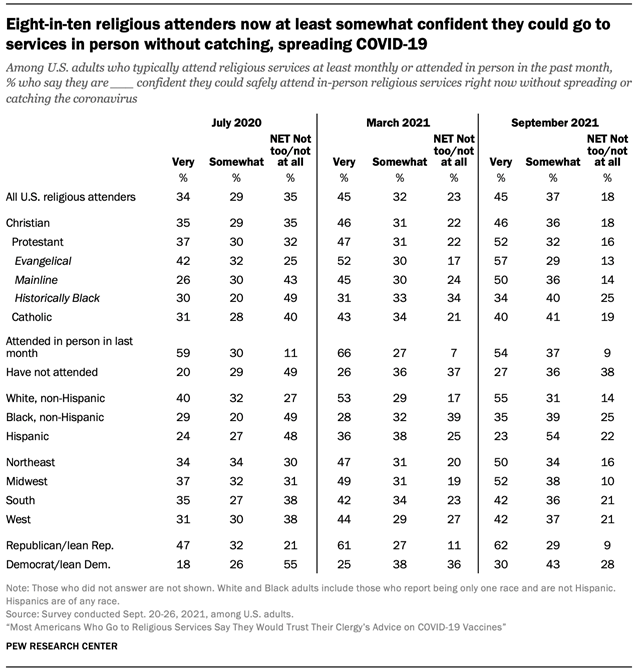
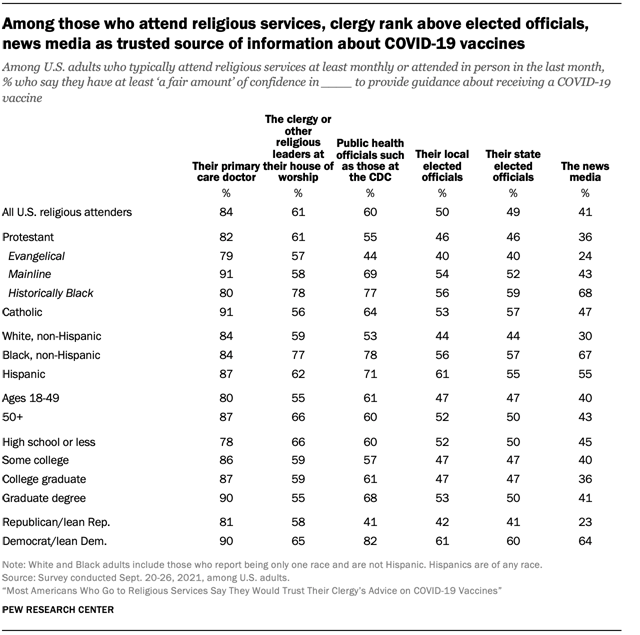
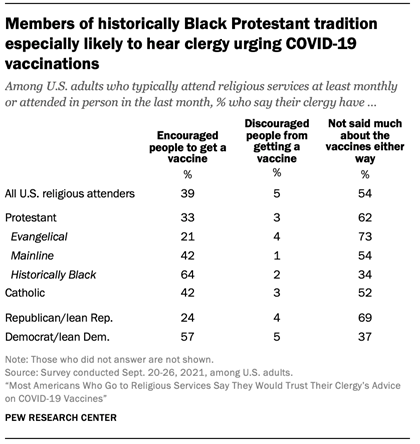
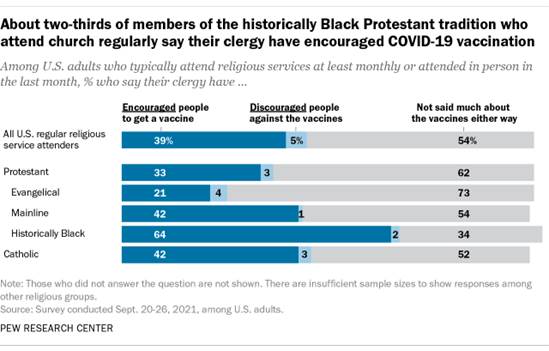
Central census divisions (31%). (PEW) OCTOBER 14, 2021 Half Of U S Congregants (54%) And Nearly Three-Quarters Of
Evangelical Churchgoers (73%) Say Their Clergy Have Not Said Much About
Covid-19 Vaccinations Either Way The survey finds that a growing share of
Americans are now attending religious services in person. Among those who say
they typically attend services at least once or twice a month, a clear
majority (64%) report that they actually have gone in person in the past month, the
first time that has been the case in three surveys conducted since the
pandemic began. The resumption of in-person attendance has been accompanied
by a decline in the share of both U.S. adults overall and regular worshippers
who say they have watched religious services online or on TV in the past
month. (PEW) OCTOBER 15, 2021 Roughly Eight-In-Ten Members (82%) Of The Historically
Black Protestant Tradition Who Attend Church Once A Month Or More Have
Received At Least One Dose Of A Covid-19 Vaccine Roughly eight-in-ten members (82%) of the
historically Black Protestant tradition who attend church once a month or
more have received at least one dose of a COVID-19 vaccine, compared with 60%
of those from the same religious tradition who attend church less often,
according to the analysis, based on a survey conducted Aug. 23-29, 2021. A later poll, fielded Sept. 20-26, sheds
some light on possible explanations for this large gap: Nearly two-thirds of
regular churchgoers in the historically Black Protestant tradition (64%) say
that their pastors have encouraged people to get a COVID-19 vaccine. (PEW) OCTOBER 15, 2021 (Canada) Pandemic Within A Pandemic: Most (69%) Believe There Is A
Mental Health Pandemic In Canada As the COVID-19 pandemic continues to wreak
havoc across Canada, the results of a new Ipsos poll conducted on behalf of
Ontario Shores Centre for Mental Health Services suggests that we may be
dealing with another pandemic, within the coronavirus pandemic. The poll
reveals that most (69%) Canadians believe there is a mental health pandemic
in their country. Millennials and Gen Xers are among the most likely to
believe that Canada is facing a mental health pandemic (75% vs. 61% of Gen
Zers & Boomers). (Ipsos Canada) 4 October 2021 Four In Ten (40%) Working Canadians Say They’ve Experienced
A Decline In Their Physical Health Throughout The Pandemic As vaccination rates have ramped up across
the country, and businesses are starting to prepare for a post-pandemic future,
working Canadians continue to face a number of health-related challenges.
Four in ten (40%) working Canadians say they’ve experienced a decline in
their physical health throughout the pandemic, according to a recent Ipsos
poll conducted on behalf of RBC Insurance. The inability to socialize with
family, friends or co-workers (72%) and work-related stress (58%) were also
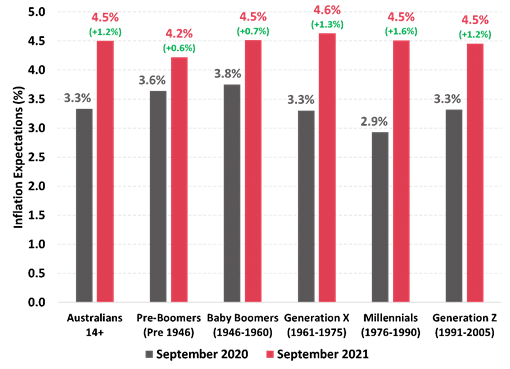
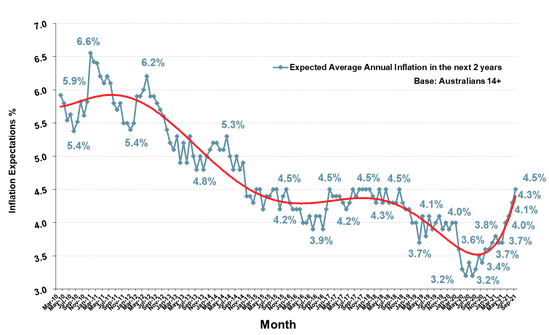
cited as factors impacting overall health. (Ipsos Canada) 5 October 2021 AUSTRALIA (Australia) Inflation Expectations Up 0.2% Points To 4.5% In September;
Highest For Three Years Since October 2018 In September 2021 Australians expected
inflation of 4.5% annually over the next two years, up 0.2% points and the
highest Inflation Expectations for three years since October 2018. Inflation
Expectations are now a large 1.2% points higher than a year ago in September
2020 (3.3%). Inflation Expectations are still 0.2% points below their
long-term average of 4.7% but are now a full 1% point higher than the record
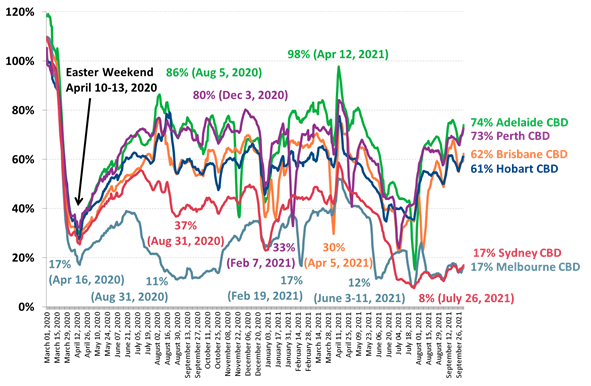
low 2020 monthly average of 3.5%. (Roy Morgan) October 11 2021 Movement In The Sydney CBD At Only 17% Of Pre-Pandemic
Levels Before Greater Sydney Prepared To Leave Lockdown The average 7-day movement level in the
Sydney CBD hit a low of 8% of pre-pandemic levels in late July and have slowly
increased since then as restrictions have been eased as vaccination rates
have increased rapidly. Late last week NSW hit a mark of 70% of the
population aged 16+ being fully vaccinated which is the mark that was set for
the ending of the lockdown of Greater Sydney this week. (Roy Morgan) October 11 2021 Sydney FC Is The Most Widely Supported A-League Club As
Support Rises For The League Overall Close behind in second place are
traditional rivals Melbourne Victory with
632,000 supporters, an increase of 46% on a year ago. The Victory have been the second most
successful club in the A-League Men winning 4 Championships with their most
recent win in the 2017-18 season. (Roy Morgan) October 12 2021 (New Zealand) Support For New Zealand’s Labour/Greens Government
Increased 3.5% Points To 55% In September The governing parties are now 14% points
ahead of the Parliamentary opposition National/Act NZ/ Maori Party on 41%, up
0.5% points since August. The increase was driven by another rise in support
for Act NZ up by 3% points to 16%. This
is a new record high in support for Act NZ. In contrast, support
for National was down 2% points to 23%, the lowest since March 2021. Support
for the Maori Party was down 0.5% points to 2%. (Roy Morgan) October 04 2021 MULTICOUNTRY STUDIES On Average, Eight In 10 (79%) Across 30 Countries Say That
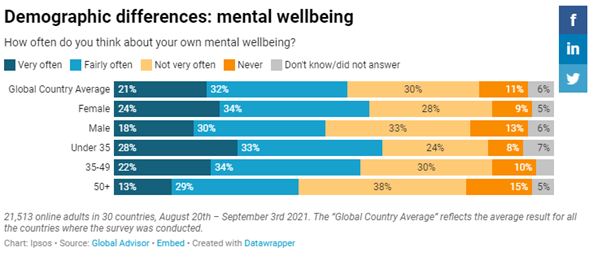
Their Mental And Physical Health Are Equally Important On average, eight in 10 (79%) across 30
countries say that their mental and physical health are equally important
when it comes to their personal health. But only one-third (35%) think that
healthcare systems in their country treat mental and physical health with
equal importance. A larger proportion (42%) think healthcare treats physical
health with greater importance. While over half (53%) across all countries
say that they think about their mental wellbeing ‘fairly’ or very’ often,
people tend to think about their physical wellbeing more frequently (68%
fairly/very often). (Ipsos Egypt) 8 October 2021 Source: https://www.ipsos.com/en-eg/world-mental-health-day-2021 Italians And The French Are The Most Pessimistic With One
In Five (19% And 20% Respectively) Saying That It Is Already Too Late To
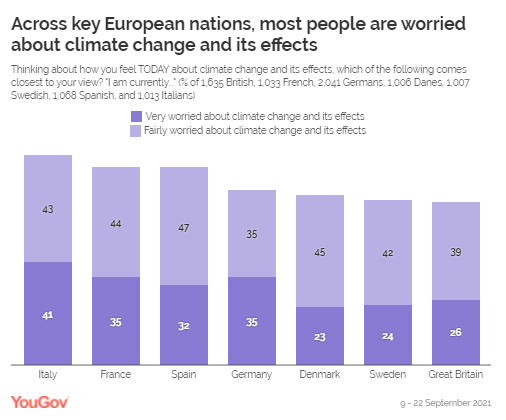
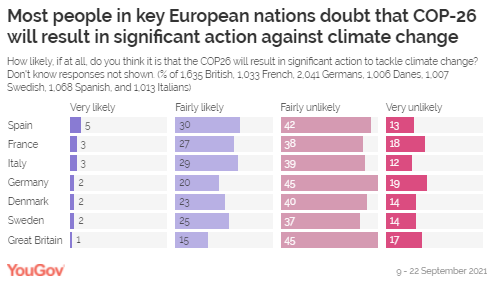
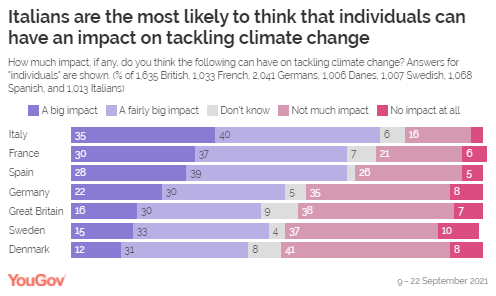
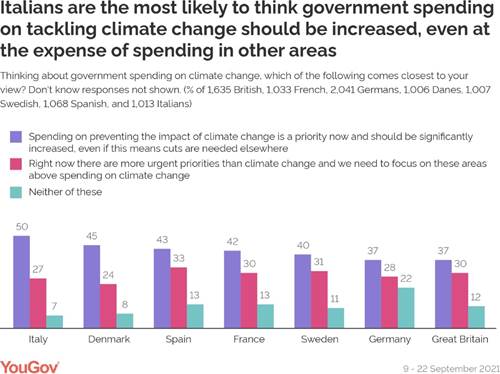
Avoid The Worst Effects Of Climate Change Climate change is a sizeable concern across
the countries studied. A majority of adults in Italy (84%), Spain (79%),
France (79%), Germany (70%), Denmark (68%), Sweden (66%) and Britain (65%)
all say they are worried about climate change and its effects. Italians and
the French are the most pessimistic about what can be done to tackle climate
change, with one in five (19% and 20% respectively) saying that it is already
too late to avoid the worst effects. Spaniards have the most positive
outlook, with just 1 in 11 (9%) saying it is too late, and three quarters
(73%) saying that the worst effects can still be avoided if drastic actions
are taken. (YouGov UK) October 12, 2021 A Global Country Average Of 64% Rate
Doctors As Trustworthy The Ipsos' Global Trustworthiness Index has reported the level of
trust afforded to many types of professionals since 2018, providing
comparisons between the pre-pandemic world and where we are today. Across 28 markets
around the world, a Global Country Average of 64% rate doctors as
trustworthy, followed by scientists at 61% and teachers on 55%. On foot of
the trust table, only 10% on average believe politicians are trustworthy, 14%
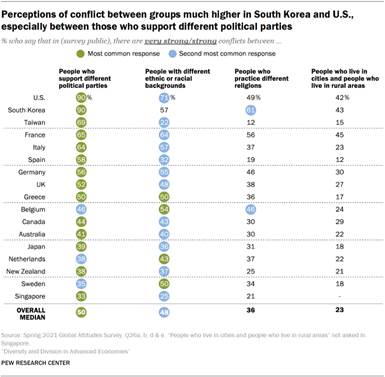
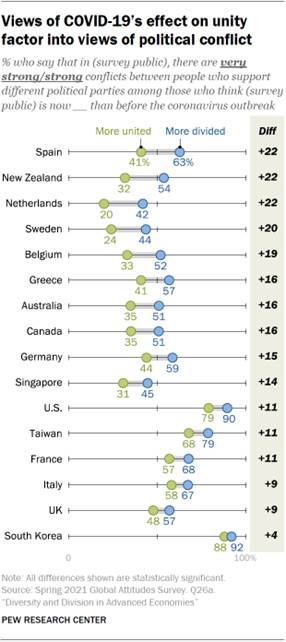
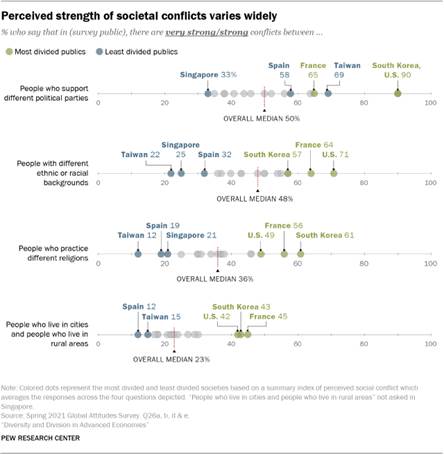
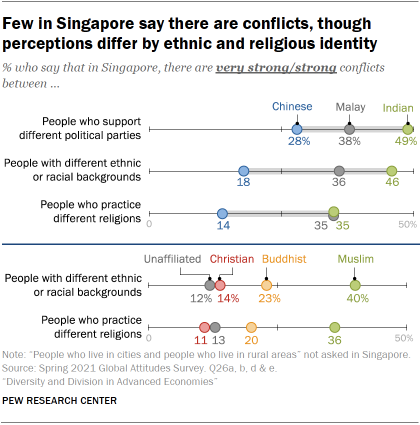
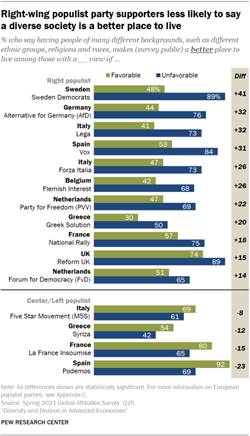
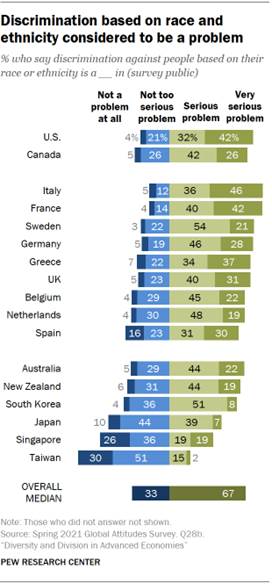
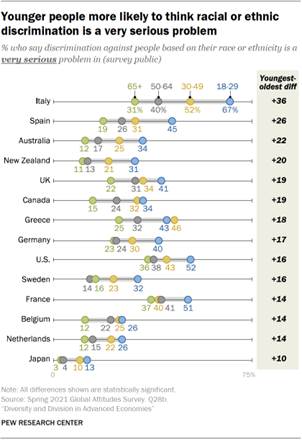
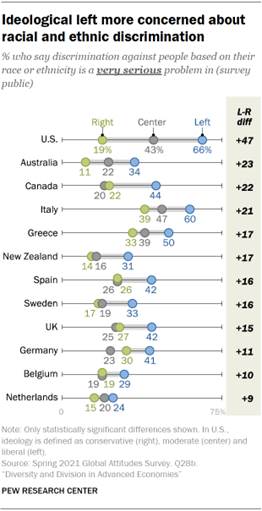
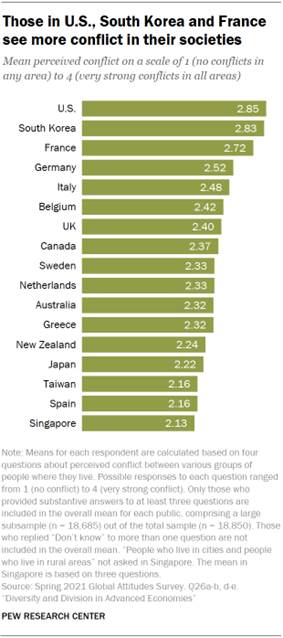
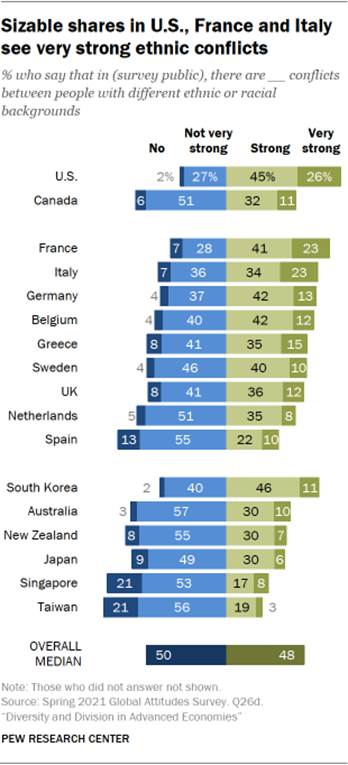
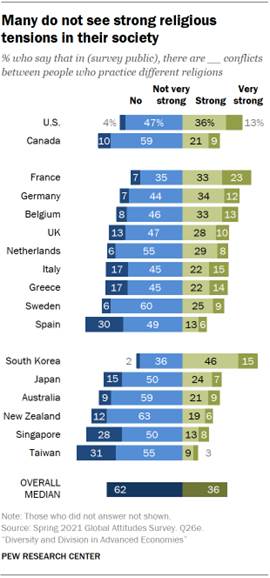
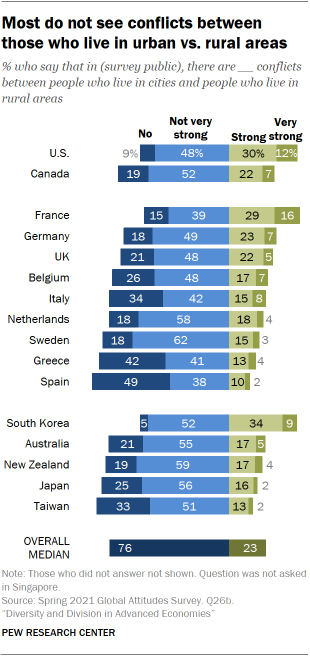
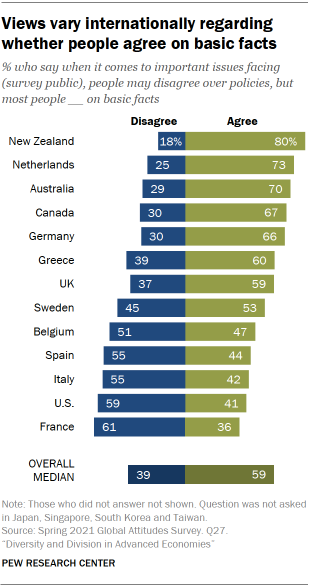
say the same about government ministers, and 15% advertising executives. (Ipsos Egypt) 12 October 2021 Source: https://www.ipsos.com/en-eg/global-trustworthiness-index-2021 Diversity And Division In Advanced Economies When it comes to perceived political and
ethnic conflicts, no public is more divided than Americans: 90% say there are
conflicts between people who support different political parties and 71% say
the same when it comes to ethnic and racial groups. More in South Korea than
in any other public surveyed say there are conflicts between people who
practice different religions (61%) in their society. Although it is ethnically and racially diverse – and even boasts four official
languages that correspond with the dominant ethnic groups – fewer
Singaporeans (25%) report conflicts between people of different ethnic and
racial backgrounds than nearly any other public surveyed. (PEW) OCTOBER 13, 2021 Source: https://www.pewresearch.org/global/2021/10/13/diversity-and-division-in-advanced-economies/ ASIA
711-712-43-01/Polls Record
196,000 Students Cut Class In Japan During Fy2020 During Covid-19 Crisis
A record 196,127 elementary and junior high
school students skipped classes for reasons other than illness, financial
circumstances and precautions against infections in fiscal 2020, according to
a survey by the education ministry. The ministry noted the COVID-19 pandemic as
one reason for the record truancy, saying it has taken a toll on many
children’s physical and mental health. The total number of suicides by students
reported by elementary, junior high and senior high schools also hit a record
high 415, the most since the ministry began keeping statistics in 1974. The actual number, however, could be higher
than the figure schools reported. National Police Agency data shows 507
elementary, junior high and senior high school students, including those
whose cause of death has yet to be officially determined, took their own
lives in fiscal 2020. The number of elementary and junior high
school students refusing to attend classes for 30 days or more rose 8.2
percent from fiscal 2019, which ended in March 2020, according to the latest
survey of elementary, junior high and senior high schools as well as boards
of education. Of the 196,127 truant students, 63,350 were
elementary school children, up 10,000 from the previous fiscal year. The
figure for junior high school students rose 4,855 year on year to 132,777. The number of truant elementary and junior
high school children has risen for eight consecutive years and in fiscal 2020
marked the highest since comparable data became available in fiscal 1991. “Lethargy and anxiety” was the most cited
reason for truancy, at 46.9 percent, up 7 percentage points from fiscal 2019.
It was followed by “disruptions to daily lives, playing and delinquency,” at
12 percent. The survey also showed 20,905 elementary
and junior high school students were not deemed truant but chose not to
attend classes for 30 days or more out of fears of contracting the novel
coronavirus. The number of truant senior high school
students dropped by 7,049 from fiscal 2019 to 43,051. Of the 415 suicides, seven were elementary
school children, three more than the previous fiscal year. The figure for junior high school students
rose by 12 from a year earlier to 103, while that for senior high school
students was up 83 year on year to reach 305. Suicides by female senior high school
students surged by 68 from a year ago to 131. Among the most cited factors behind
suicides were family trouble, mental illness, difficulty in choosing the
course of one's life and being scolded by parents. An education ministry official
indicated that more students refused to attend classes following changes to
their lifestyle brought on by the pandemic, such as nationwide school
closures in spring last year and staggered commuting times. “They may have not felt like going to
school due to disruptions to their daily lives and restrictions on school
events,” the official said. Family problems and being scolded by
parents were also commonly cited factors behind suicides of students in past
surveys by the ministry. The official said the pandemic may have
exacerbated such problems as many children spent more time with their
families at home. The latest survey also showed 517,163 cases
of bullying were reported by elementary, junior high and senior high schools
in fiscal 2020, down 15.6 percent from a year earlier. The figure dropped for
the first time in seven years. The ministry attributes the decline to less
interaction between children amid the pandemic. A total of 18,870 cases were reported of
students receiving abusive messages on computers or smartphones, up
5.3 percent from fiscal 2019. The figure marked the highest since a
question asking about the issue was added to the survey in fiscal 2006. (Asahi Shimbun) October 14, 2021 Source: https://www.asahi.com/ajw/articles/14460781 711-712-43-02/Polls More Than
Half 51% Of Urban Indians Think This Is A Good Time To Invest In Real Estate
As brands prepare to lure consumers this
festive season with attractive offers and deals, YouGov’s Diwali Spending
Index, an indicator of spending propensity, reveals a recovering appetite to
spend during festive season among urban Indians. As Diwali is believed to be an auspicious
period to make investments in property, YouGov’s new research examines
factors such as attitudes, purchase intent and reasons that urban Indians
consider before making real estate purchase. Data suggests that more than
half (51%) of urban Indians agree with the statement - “This is a good time to invest in real estate in
India”, which is a positive sign for real estate companies and
property dealers. Only one in eight (12%) disagree, while 27% remain
undecided. When it comes to their property buying
plans, more than a third (35%) of urban Indians said they plan to invest in
real estate in the next six months. Among these intenders, adults between
25-44 years are most likely to say this than the rest. Among the genders, men
were more likely than women to say they will invest in property, while among
the city-tiers, we see tier I (39%) and tier II (38%) city residents holding
this view more strongly than tier-3 residents (30%). The data shows that while most of the
people looking to invest in real estate are planning to buy residential
property (72%), a considerable proportion (25%) wants to invest in commercial
properties. The top way of financing their plans is
through home loans (as said by 38%). Using savings is the next best option
(30%), followed by financing their dream by selling another property (21%). Availability of loans at a low interest
rate could be encouraging people to explore the idea of investing in real
estate this festive season, as 16% of respondents claimed this to be their
reason. However, delay of the original plan to buy due to the pandemic has
emerged as the top reason to invest in property this year (19%). Other
reasons include better prices (17%), intention to save and buy a property in
2021 (17%), and availability of funds due to recent financial gains (15%). Affordable properties under ₹50 Lakhs
have emerged as the most preferred with more than two in five (44%) willing
to invest that amount. The ₹50 Lakh - ₹1 crore budget range
property is at the second spot with 41% urban Indians looking to invest that
amount. People residing in North India (44%) and those staying in the Tier I
cities (48%) are most likely to invest within this price range. Only 9% property seekers in urban India are
willing to invest in properties above ₹ 1 crore. When asked about their sources of
information regarding property and real estate, recommendations from family
and friends (48%), real-estate websites (45%) and local brokers or property
agents (42%) appeared as the top sources that people have used or are using
in their quest to find the ideal property. Among real-estate websites, 99Acres and
MagicBricks appear to be the most popular, and roughly two-thirds claim to
have used these sites for information. OLX Homes, Housing.com, Nobroker, India Property, Real Estate
India are some of the other websites used by urban Indians for this purpose. (YouGov India) October 6, 2021 Source: https://in.yougov.com/en-hi/news/2021/10/06/more-half-urban-indians-think-good-time-invest-rea/ 711-712-43-03/Polls Anxiety Of
Parents Increased To 46% In Face-To-Face Education
Face-to-face education in primary,
secondary and high schools affiliated to the Ministry of National Education
(MEB) started on September 6, after one and a half years. Millions of
students were required to attend classes five days a week. This longed-for
environment created satisfaction for parents and students. It can be stated
that the increase in the number of cases in the last days after this opening
has caused the parents to become uneasy and the anxiety situation to rise.
After the opening of the schools, the increase in the number of students
caught in the corona virus and the quarantined classrooms increased the
anxiety rate and feelings of anxiety in the parents. Half of the parents,
46%, stated that they felt more uneasy because their children were going to
school.
In the first week when schools opened,
parents were not very positive about the measures taken at schools, but the
rate of parents who thought that the measures were sufficient was higher than
those who thought that the measures were insufficient. However, when it comes
to today, 39% of the parents find the measures sufficient, while half of them
think that the measures taken are insufficient.
While 55% of parents find it safe for their
children to go to school, one out of every 3 parents state that they do not
find it safe. While the rate of parents who said they did not find it safe in
the first week of school opening was 27%, this rate has increased to 34% in
the past 3 weeks. Health Minister Fahrettin Koca
announced that PCR tests cannot be applied to children without parental
consent. 37% of parents say that they will allow their children to undergo
PCR testing, and 50% say they will not. Percentage of Parents Who Think It's Right
to Have Children PCR Tested in Schools 38% In order to see the course of the epidemic,
38% of parents find PCR testing correct in some schools. On the other hand,
the rate of parents who oppose this decision is 45%.
With the increase in the number of cases
seen in schools, the rate of those who think that the measures taken are
insufficient started to increase compared to the first weeks. Although this
situation has started to cause uneasiness, more than half of parents with
school-aged children continue to think that it is safe to go to school
face-to-face for their education. On the other hand, taking the necessary
precautions at the right time and ensuring the continuity of face-to-face
education is also an important need for parents; For this reason, we see that
there is a divergence in opinions about whether or not PCR testing should be
done in schools, and an attitude that varies according to the course. Whether
or not PCR testing should be given to children in schools and how it will be
applied seems to be one of the issues to be discussed in the coming days. (Ipsos Turkey) 4 October 2021 Source: https://www.ipsos.com/tr-tr/yuz-yuze-egitimde-velilerin-tedirginligi-46ya-yukseldi MENA
711-712-43-04/Polls In Expo 2020 Dubai, An Average Of 42% Respondents Agreed
These Brands Fit Well With The Event
After a year’s delay, Expo 2020 Dubai
opened its doors to visitors eager to witness the first World Expo in the
region. As brands prepare to engage consumers in a unique way, YouGov
evaluated brand and sponsorship awareness for Expo 2020 Dubai partner brands
before the start of the event. In September, ahead of the launch ceremony,
aided sponsorship awareness averaged 39% across the 31 Dubai partner brands
among respondents familiar with the brands. Emirates registered the highest
awareness (at 64%), followed by Etisalat (also at 64%), Dubai Chamber (57%),
Emirates NBD (56%) and Emaar Hospitality (55%). Understanding of sponsorship When asked if they believe specific brands
are suitable sponsors for the Expo 2020 Dubai, an average of 42% respondents
agreed these brands fit well with the event. While technology is at the heart of the
Expo, the diversity of cultures is reflected in the food, with Emaar leading
the way as the official catering, hotel and hospitality partner. Most
respondents agreed Emaar Hospitality fits well with Expo 2020 Dubai (51%).
Other high scoring brands on this aspect were Mastercard (48%) and DP World
(47%). Going one-step further, an average of 32% agreed
with the statement, ‘I believe this
brand complements and contributes towards the objective of Expo 2020 Dubai’.
Agreement was the highest for brands such as SAP (39%), Dubai Expo’s official
Beverage and Snack Partner PepsiCo and Dulsco (36% each). Brand activity around sponsorship When asked if respondents recall seeing an
advertisement recently about specific partners related to Expo 2020 Dubai,
highest awareness was registered for ads by Emirates, Etisalat and Dubai
Chamber. At the other end of the spectrum, brands such as Dettol, L’Oréal and
Dominos registered Ad Awareness of below 20%. At an overall level, average awareness of
Expo-linked ads across all Expo 2020 Dubai partners was 26%. Awareness of Expo 2020 Dubai-related
activations such as partner programmes, events and pavilions varied by
partner, but on average just under nine out of ten UAE residents had a high
positive Impression of and likelihood to engage with activations that they
were aware of. Impact of sponsorship on brand metrics When measuring Buzz score (whether one has
heard something positive or negative about a brand), one of the sixteen
metrics measured in YouGov’s daily brand tracking tool BrandIndex, we saw partners experienced an average
20% positive Buzz uplift as a result of the Expo 2020 Dubai sponsorship (by
comparing those aware of the sponsorship vs unware). Highest Positive Buzz
uplift was experienced by brands like Swatch (36%), Dettol (31%) and SAP
(30%). The positive Buzz is likely to have boosted
Impression (whether one thinks positively or negatively about a brand), with
partners experiencing an average of 15% positive Impression uplift because of
Expo 2020 Dubai sponsorship. Brands that benefited the most to date were
Siemens, PepsiCo and Nissan, with all receiving uplifts of over 20%. Commenting on this, Sam Dawson, Commercial Director, YouGov MENA,
said, “The data shows the power of
association with Expo 2020 Dubai even before opening, indicating not only
that consumers are receptive to partner brands but that their involvement can
positively contribute to the event. As the Expo progresses and engagement
opportunities increase, there is significant headroom for growth in sponsor
awareness and potential further uplift in brand metrics throughout the
marketing funnel.” (YouGov MENA) October 11, 2021 Source: https://mena.yougov.com/en/news/2021/10/11/expo-2020-dubai-powerful-association-sponsor-brand/ AFRICA
711-712-43-05/Polls About 8 In
10 Nigerians (76 Percent) Especially In The North-East (93 Percent) Zone
Believe That Nigeria Is Better As A Nation
Abuja, Nigeria.28th September 2021.
A new public opinion poll conducted by NOIPolls has revealed that about 8 in
10 Nigerians (76 percent) especially in the North-East (93 percent) zone
believe that Nigeria is better as a nation, although a considerable
proportion 24 percent especially from the South-East zone (62 percent) think
otherwise. Further findings showed that 77 per cent of
the respondents disclosed that they are proud to be Nigerians. However, this
stance varied across the geo-political zones, where the highest figure was
recorded in the North-East (89 percent) and North-West zone (87 percent) and
the lowest obtained in the South-East (48 percent) and South-West (67
percent) zones respectively. Moreover, the greatest achievements of
Nigeria at 61 years were perceived to be Unity (17 percent), Democracy (14
percent), Agricultural development (8 percent), and telecommunications (8
percent). On the contrary, it is instructive to note that 36 percent of
respondents felt Nigeria has achieved nothing in 61 years of its independence
and this assertion is predominant amongst Nigerians residing in the South-East
(64 percent), South-West (50 percent), and North-Central (46 percent). Finally, while there have been recent
agitations for the breakup of Nigeria, poll results reveal clearly that the
breakup agenda cannot be sustained as the overwhelming proportion of
Nigerians are proud to be Nigerians. For sustenance of this embedded pride in
the Nation, there is a need for government to create and nurture a culture of
inclusive governance with a two-way symbiotic relationship between the
government and the Nigerian citizens. This will significantly raise eagerness
and participation towards governance, while enhancing the common pursuit of
national development for the good of the Nigerian populace, thus
automatically reinforcing the feeling of patriotism and pride in the nation.
These are some of the key findings from the Independence Day Poll conducted
in the week commencing September 6th,
2021. Survey Background For one, citizenship embodies the rights
and duties of citizens, for another, citizenship is also ‘essential for
cultivating civic virtues and democratic values.[1] Whereas there can be no citizens
without states, ‘states without citizens’[2] exist where the state falters on
almost all its salient responsibilities, forcing the ‘citizens’ to resort to
alternative coping strategies, including resorting to self-help strategies.
The denial of full citizenship to individuals or groups for whatever reasons
as this scenario depicts, is usually accompanied by a drastic fall in
citizens’ level of nationalism, participation, and trust in political
institutions and political class. Any citizen or group of citizens who feel
genuinely alienated, marginalized, or discriminated against by the political
system may not be sufficiently inspired to publicly proclaim or assert their
citizenship of such a political system. For such a group of people, political
independence counts for little since it could not offer them adequate
protection in terms of rights, participation, and identity. There is a sense
in which it can be argued that the nationalists who fought colonialism,
nurtured expectations that political independence would offer a sustainable
path to redemption, including the citizenship question. But as it has turned
out, the initial hope of independence has been squandered under successive
military regimes. The struggle to reclaim hope led to what
some have labelled the second independence movement[3], embodied by the largescale movements in
the late 1980s and early 1990s for democratization. While the battle was
partially won with the return to a democratic civil regime in 1999, the
crises and contradictions of the democratization process have also dampened
the high expectations that attended the return to democracy. There is, therefore, a new phase of the
independence movement concerned mainly with the pressure of good governance,
one that can deliver the dividends of democracy to its citizens. It is only
within such a democratic order[4], predicated upon popular legitimacy,
transparency, accountability, and effective service delivery that the notions
of citizenship and independence assume any useful meaning. Against the
background, NOIPolls conducted a public opinion poll to assess the
perceptions of Nigerians on citizenship, patriotism, and Nigeria’s
independence, which are very critical to any nation-state project. Survey Findings Nationalism is an essential component of
statehood. It generally represents the deep feelings of attachment and
belonging in citizens that inspire supportive attitudes and behaviours
towards nationalistic symbols. One way of expressing this is the pride of
being a citizen of a country. When asked whether they were proud to be
Nigerians or not, it is gratifying to note that an overwhelming majority
answered in the affirmative. Overall, 77 percent of the respondents said they
were proud to be Nigerians, while 23 percent felt otherwise. This is
gratifying, especially in the face of ongoing agitation for secession and
other critical challenges to the corporate existence of the country. Further analysis by geographical revealed
that the least expression of pride in being a Nigerian was seen in the
South-East region (48 percent) followed by the South-West (67 percent),
whereas the highest level of patriotism was witnessed in the North-East (89
percent) and North-West (87 percent).
Trend analysis revealed a consistent drop
in the level of patriotism from 2013 to 2021 and an 8 percent decrease when
current findings are compared with results obtained in 2019.
Subsequently, when asked what they love
most about being a Nigeria, 35 percent mentioned cultural diversities, 24
percent said unity and 22 percent stated that they don’t love anything about
being a Nigerian.
When respondents were asked about Nigeria’s
founding fathers or past leaders that inspire them the most, the result
showed that Umaru Ya’radua (21 percent) and Goodluck Jonathan (19 percent)
were Nigeria’s past leaders that inspired Nigerians the most. Other names
mentioned are Olusegun Obasanjo (8 percent), Late Dr Nnamdi Azikiwe (7
percent) and Late Sir Abubakar Tafawa Balewa (6 percent) amongst other
founding fathers and past leaders.
Furthermore, Security (40 percent), Economy
(17 percent), and Job creation (12 percent) have been identified as the top
three issues Nigeria as a nation needs to address within one year. Other
mentions include corruption (7 percent), poverty (5 percent), electricity
supply (5 percent), and education (4 percent) amongst other issues stated.
In the assessment of respondents, the
greatest achievements of Nigeria in its 61 years of political independence
since 1960 include Unity, democracy, agricultural development, and
telecommunications. The chart below reveals the following proportion of
respondents; 17 percent, 14 percent, 8 percent, and 8 percent opted for these
accomplishments respectively. On the contrary, it is instructive to note
that 36 percent of respondents felt Nigeria has achieved nothing in 61 years
of its independence and this assertion is predominant amongst Nigerians
residing in the South-East (64 percent), South-West (50 percent), and
North-Central (46 percent).
When asked whether they feel they can and
are free to live and do business in any part of Nigeria, the poll findings
revealed that 53 percent of the respondents answered in the affirmative.
However, it is worrisome to note that a sizeable number of the respondents
(47 percent) thought otherwise. Geopolitically, there are variations in
being able to and free to live and do business in any part of Nigeria.
Concerning those who said yes, which has nationwide support of 53 percent of
the respondents, the South-South and the North-Central fared better than the
national rating at 65 percent and 57 percent respectively. On the other hand,
the North-East, North-West, South-East and South-West fell below the national
score with 47 percent, 52 percent, 46 percent, and 49 percent of the
respondents respectively.
When respondents were asked whether Nigeria
is better as a nation or being divided, it is worthy to note that an
overwhelming majority answered in the affirmative. Overall, 76 percent of the
respondents said that Nigeria is better as a nation, while 24 percent felt
otherwise. This is gratifying, especially in the face of ongoing agitation
for secession and other critical challenges to the corporate existence of the
country. More findings across social categories
revealed some variations in terms of gender, geographical locations, and age
distribution. For instance, while the North-East region had more respondents
who stated that Nigeria is better as a nation, the South-East zone had the
lowest number of respondents who asserted this perspective.
Respondents were further probed, and the
poll revealed that those who stated that Nigeria is better as a nation gave
reasons such as ‘we can achieve more together’ (39 percent), ‘division will
cause more harm’ (28 percent), ‘Nigeria is better as a nation ‘ (15 percent),
and ‘we need restructuring not division’ (10 percent) amongst other reasons. On the other hand, ‘too much sentiment and
tribalism’ (36 percent), ‘some regions are being marginalized’ (32 percent),
‘division will bring peace’ (15 percent), and ‘bad government’ (9 percent)
amongst other reasons.
Conclusion In conclusion, the results have revealed
that most Nigerians are proud to be Nigerians and a sizeable proportion (77
percent) of the respondents especially in the North-East (93 percent) zone
believe that Nigeria is better as a nation. Therefore, for the sustenance of
this embedded pride in the Nation, there is a need for government to create
and nurture a culture of inclusive governance with a two-way symbiotic
relationship between the government and the Nigerian citizens. This will
significantly raise eagerness and participation towards governance, while
enhancing the common pursuit of national development for the good of the
Nigerian populace, thus automatically reinforcing the feeling of patriotism
and pride in the nation. Finally, more efforts should be made to
foster a sense of national belonging, unity, and integration. As this poll
reveals, responses tended to follow a certain geopolitical pattern that
suggests a great deal of discontent across regions. Paying more attention to
the ongoing debate about political restructuring is potentially one of the
ways by which the problem can be addressed. (NOI Polls) October 5, 2021 Source: https://noi-polls.com/independence-day-poll-report-2/ 711-712-43-06/Polls More Than
Half (55%) Of South Africans Believe That “Most” Or “All” Police Officials
Are Involved In Corruption
South Africans’ trust in the country’s
police is at historically low levels, new Afrobarometer survey findings show. Popular trust in the South African Police
Service (SAPS) has declined by about half over the past decade. A majority of citizens think
most police officials are corrupt, and some citizens report having to pay bribes to obtain
police assistance or avoid problems with the police. These findings point to a crisis of
confidence in the SAPS, which has been plagued by scandals over the past decade. Four of the
country’s seven post-apartheid National Police Commissioners have been dismissed from
office and convicted on charges ranging from fraud and corruption to dishonest conduct. On 7 October, President Cyril Ramaphosa
announced that National Police Commissioner Khehla Sitole had been served with a notice
of intention to suspend him, stoking speculation that the country’s top police official may
be dismissed in the coming weeks. Sitole, who was appointed in 2017 by former President Jacob
Zuma, has been accused of misconduct in connection with his alleged role in
frustrating internal police investigations. Key findings ▪ Only one-fourth (26%) of South
Africans say they trust the police “somewhat” or “a lot” – about half as many as in 2011 (49%)
(Figure 1). o Distrust of the police is at its highest
level of the past two decades, with 73% of citizens saying they trust them “just a
little” or “not at all.” o The police trail other public
institutions in popular trust, including the army (53% “somewhat” or “a lot”), the courts (43%),
and the president (38%) (Figure 2). ▪ More than half (55%) of South
Africans believe that “most” or “all” police officials are involved in corruption, the worst
assessment recorded over the past decade. In addition, 36% think that “some” police
officials are corrupt (Figure 3). ▪ Among citizens who say they had
contact with the police during the previous 12 months, one in four (24%) report having to
pay a bribe, give a gift, or do a favour in order to avoid problems, while 15% say they
did so to get the assistance they needed (Figure 4). (Afrobarometer) 8 October 2021 WEST
EUROPE
711-712-43-07/Polls The Conservatives Have Now Dropped To 41% In Red Wall Vote Intention
Ahead of the Conservative party conference, YouGov polling data shows
a definite mixed bag for Boris Johnson and his government. Despite ongoing
domestic policy crises, the Conservatives still lead in voting intention,
with Labour unable to cut through and fully catch up. However, the Conservative lead is certainly slender and fragile – as
a brief Labour lead in the polls two weeks ago after the National Insurance
tax rise announcement showed. Last week, we revealed that the Conservatives would be set to lose 12
Blue Wall and 17 Red Wall constituencies to Labour, if an election were held
tomorrow. Labour were catching them up in terms of vote intention, but the
Conservatives still enjoyed a healthy lead in both areas. Now, however, YouGov data shows the Conservatives and Labour neck and neck in the so called ‘Red
Wall’ of pivotal Northern, Midlands, and North Wales constituencies. A
multilevel regression and post-stratification (MRP) model of constituency
vote intention shows that the Conservatives could be set to lose up to 32 Red
Wall seats to Labour, if an election were held tomorrow. According to our MRP model, estimated using almost 10,000
respondents, the Conservatives have now dropped to 41% in Red Wall vote
intention. That’s seven points down on 2019, and two points below their 2017
showing under Theresa May.
Labour, meanwhile, have gone up two points, from 38% in 2019 to 40%
now, just one point behind Johnson’s party. While this is somewhat
encouraging news for Keir Starmer, it still represents a 10-point drop for
them on their 2017 result. According to our latest data, if an election were to be held tomorrow,
four Red Wall Conservative constituencies would be firmly back in Labour’s
hands (including Redcar, North West Durham, and Heywood and Middleton).
Another 14 (including Stoke-on-Trent Central, Bolton North East, and Wrexham)
would also be likely to fall, and a further 14 (including Darlington, Blyth
Valley, and Leigh) are too close to call. The Conservatives still hold on strongly to 10 of their 2019 election
seizures in the region (including Don Valley, Bishop Auckland, and Dudley
North), with a slightly weaker hold over a further nine seats that they would
nonetheless still be likely to keep (including Wakefield, Bolsover, and
Workington).
Wider woes The British public are becoming increasingly dissatisfied with the
government’s performance – including on key issues such as inflation – and
are beginning to lose faith in Johnson as a leader. A majority of the public now disapprove of the government’s record to
date, with the latest figures indicating
54% disapproval versus 26% approval. Furthermore, as prices continue to
rise, supply chain issues worsen, and the fuel crisis hits, a majority of the
public now also think that the government is handling
inflation (54%) and the
economy (55%) badly (versus 26% and 33% respectively who believe
they are managing them well). Boris Johnson’s personal
ratings have taken a serious hit too, with 60% now thinking he is doing
badly as Prime Minister (vs 35% well), and 41% of the public believing he
should stand down as leader of the Conservative party (36% believe
he should remain). What will make this most uncomfortable for Prime Minister are the
figures among 2019 Conservative voters. As of now, over a quarter (27%)
believe he is doing a bad job, and almost one-in-five (18%) think he should
resign (on the other hand, 69% think he is doing well, and the same figure
believe he should remain in post). (YouGov UK) October 04, 2021 711-712-43-08/Polls More People Are Unconfident In The Police (48%) Than Confident (43%)
Following several high-profile murders of young women,
including that
of Sarah Everard by Metropolitan police officer Wayne Couzens,
coupled with botched responses from police commanders, new YouGov data
reveals the extent of the damage this has caused to public confidence.
YouGov routinely asks the British public their confidence in the
police to deal with crime in their local area, and for the first time since
we started asking in July 2019 more people are now unconfident in the police
(48%) than confident (43%). This is a stark decrease of 10 points since late February/early
March, when 53% had a lot/fair amount of confidence and 40% had not very much
or none. However, between that survey and one at the end of the month – a
period which coincided with Sarah Everard’s murder – these figures narrowed,
and had remained at that level until deteriorating further this month. This decline in confidence is actually highest among men, with
the number of men lacking confidence in the police increasing from 48% in
September to 53% now. Among women there has been a more modest shift, from
40% to 43%. With this in mind, we asked Brits about their trust in the police in
general, the Met, local forces and individual police officers. The police in
general are positively viewed by the public, with 65% saying they trust them,
and only 31% saying they don’t. People outside of London give similar results
when asked about their local police force (by 65% to 28%), and individual
police officers are likewise largely trusted (by 56% to 26%). But, when asked specifically about the Metropolitan Police in London,
trust dramatically decreases. Only 33% of the British public trust the Met,
and 42% say they do not. Distrust is highest among 18-24 year olds, at 51% to
23%. Distrust is also higher amongst men (46%), than women (37%), a pattern
witnessed across all of our measures of trust towards police. Labour
voters have less trust in the Metropolitan police (distrusting them by 29% to
49%) than Conservative voters, who are divided on the issue (by 38% to 38%). Londoners, however, remain for the most part confident in the Met,
with 57% trusting them vs 39% distrusting them. This stands in contrast to
Britons elsewhere, who tend to view the force with suspicion. (YouGov UK) October 06, 2021 711-712-43-09/Polls Death Survey Findings On Value Of Life: Religious Britons Found More
Egalitarian On Value Of Life Than Ir-Religious
In January a former Supreme Court judge and civil liberties
campaigner Lord Sumption sparked controversy when
he claimed that ‘all lives are not of equal value’. The YouGov Death Study
shows what Britons think about the value of human life. While a vast majority (73%) say all human lives are equally valuable,
one in five (20%) think this is not the case. More men (23%) than women (17%)
think that not all human lives are equally valuable. The YouGov Death Study finds that the less religious a person is, the
more likely they are to believe that all lives do not have equal value. Among
religious Britons who actively practice their faith, eight in ten (82%) think
that the lives of all humans are equally valuable, with 12% disagreeing. Three
quarters (75%) of Britons who are not practicing their religion say that all
human lives are worth the same, while 20% of them disagree. Of the Britons
who do not belong to any particular religion, 69% say all human lives have
equal value, but a quarter (24%) think they do not.
How many people have wished death on
someone? A third of Britons (32%) report they have seriously wished death upon
someone. While 8% regret it, a quarter (24%) don’t. A third of men (36%)
wished death on someone, compared to about three in ten (28%) women. Among Britons who actively practice their religion, a quarter (26%)
say they have sincerely wished for someone to die, with more of those who say
they don’t regret it (15%) than those who do (11%).
Is it ok to be pleased that someone has
died? YouGov research reveals that over half of Britons (56%) think it can
be acceptable to celebrate someone’s death, while 23% say that can never be
the case. Men (61%) are likelier than women (51%) to think it is ok to rejoice
over somebody’s death. Men aged 16-24 are significantly more likely
than all other Britons (71% vs 43-60%) to think it is ok to cheer someone’s
demise. (YouGov UK) October 06, 2021 711-712-43-10/Polls Britons Think The Government Are Handling Taxes Badly (60%), With
Just 25% Saying They’re Doing A Good Job
Economic recovery post-COVID was a key talking point at the
Conservative party conference this week, with rising prices and tax rates
featuring heavily. Our latest tracking data suggests that the public are not
enamoured by the government’s handling of either of these areas, with this
trickling over into perceptions of their overall handling of the economy. As YouGov highlighted recently,
the public have been losing trust in the government over inflation, with
prices rising over the summer and Britons now being hit with big new energy
bills. New figures now show just a quarter (26%) think the government are
handling the issue well, compared to 53% who say they are handling it badly. As a result of the poorly-received
changes to National Insurance, Britons also think the government are
handling taxes badly (60%), with just 25% saying they’re doing a good job.
Chancellor Rishi Sunak has refused to rule out further tax rises in the near
future, suggesting that the Conservatives’ problems in this area are unlikely
to abate any time soon.
The handling of these two areas has also impacted how the government
are perceived to be handling the economy overall, with the public
disapproving by 54% to 34%. Approval around the economy had been diminishing
over the summer, but the biggest change in opinion came between 19 September
– when 47% of people said the government was handling the issue badly – and
26 September when that figure had risen to 55%. Worse still for the government, this shift in opinion across all
three areas is also occurring among Conservative voters. This is particularly
notable when it comes to tax: at the end of August 59% of Tory voters thought
the government was handling tax matters well, compared to 24% badly. As of
the most recent poll, 47% say they are handling it well and 42% say badly. By 58% to 10% Britons think the economy remains in a bad state, only
a slight improvement compared to March when the country was still in
lockdown. They are just as pessimistic about Britain’s future financial
prospects: just one in five think things will get better in the next year,
compared to 53% who say the economic situation will worsen. The Tories reputation for handling the
economy is slipping away As a result of these woes, the general public are now just as likely
to say Labour are the best party to handle taxation as they are the
Conservatives, with both parties getting 25% of the vote on this issue. However, despite a slight narrowing, Starmer’s party are still a long
way off the Tories when it comes to trust in handling the economy in general.
Three in ten (29%) think the Conservatives are best on this issue, compared
to 19% who say Labour, although this still represents a tightening from 33%
vs 17% in mid-September.
The Conservatives are also at risk of losing their reputation as the
low-tax party. In fact, the public are now more likely to say taxes would
rise under the Conservatives (64%) than under a Labour government (56%).
And on the trade-off between taxes and public spending, the public
are about as likely to say the government is taxing too much (28%) as too
little (26%), while 19% think they’ve got the balance right. This is the
first time since Boris Johnson became prime minister that so many people
think taxes are too high. Conservative voters in particular are concerned
about the idea of increased taxes with 33% saying the government taxes too
much, up from 25% last month. (YouGov UK) October 07, 2021 711-712-43-11/Polls The Majority (57%) Of The Public Oppose Protesters Being Given Prison
Sentences For Blocking Motorways, Although A Third (34%) Would Support Such A
Punishment
Insulate Britain protesters have spent the past three weeks blocking
junctions on various motorways around the country, to bring attention to the
issue of climate change and petitioning the government to do more to make
homes energy efficient. The protesters have clashed with drivers and police, and the latest
YouGov polling shows that the public's patience, and support, is waning – 72%
now oppose the group's actions, up 13pts compared to when the protests first
began in mid-September. Just 18% of Brits now support the actions, compared to a quarter
(25%) who backed the group three weeks ago. Even amongst people who listed
the environment as one of the most important issues facing the country,
opposition to the protesters now substantially outweighs support. Most of
this group (58%) oppose the protesters’ actions, compared to just a third
(33%) who support them. The proportion of Brits who believe that this kind of protest hinders
the cause of the wider climate change movement has also jumped. Almost three
quarters (73%) of the public now say this sort of action damages public
perceptions of the climate change movement, up 9pts on when this was
originally asked after the first two days of protests. Just 5% think this
kind of action is helpful to the cause. Public oppose prison for protesters In an effort to stop the protesters, the government has taken out
several court injunctions to prevent protesters from blocking the M25, the
Port of Dover, and various A roads in and out of London. Protesters who are
served with an injunction face a fine or a prison sentence, but this has done
little to deter activists, with over 100 Insulate Britain protesters being
served with an injunction at the Royal Courts of Justice on Tuesday. A previous
YouGov survey showed that Britons support custodial sentences being
an option for dealing with the protestors. However, the public seem more
nervous about protestors actually being jailed in practice. The majority
(57%) of the public oppose protesters being given prison sentences for
blocking motorways, although a third (34%) would support such a punishment.
Men are much more likely to support this approach to tackling protesters, with
39% supporting imprisonment compared to just 3 in 10 (30%) women. (YouGov UK) October 08, 2021 711-712-43-12/Polls Two Thirds Of Britons (63%) Know Someone Who Has A Mental Health
Problem
Ahead of World Mental Health Day, new YouGov research shows that
approaching two thirds of Britons (63%) know someone who has a mental health
problem, including a quarter (26%) who say they suffer from such issues
themselves. A third of Britons say they have a family member with mental health
issues, 29% say a friend suffers and 15% list another acquaintance who does
too.
Only a quarter of Britons (25%) say they don’t know anyone with
mental health problems, with the rest responding either ‘don’t know’ to the
question premise (5%) or that they would prefer not to answer (7%). The older Britons are, the less likely they are to say they know
anyone with mental health problems, or to suffer from them themselves. While almost half of 18-24 year olds (49%) say they suffer from
mental health issues, this falls to 31% among 25-49 year olds, to 24% among
50-64 year olds and to just 10% among those aged 65 and older.
Fully four in ten older people (42%) say they know no-one with mental
health problems, compared to just 12% of 18-24 year olds. Men are also less likely to report having a mental health problem
than women (23% vs 29%) and are more likely to deny knowing anyone else with
such a problem (32% vs 19%).
Four in ten Britons lack confidence in
their ability to help a loved one with their mental health When it comes to helping out someone with mental health issues, four
in ten Britons (39%) say they do not feel well equipped to do so. Men are
particularly likely to feel this way, at 45% to 33% of women. Despite the big differences we saw among age groups on knowing
someone with mental health problems, the gaps on feeling able to help someone
are much more modest. While a third of 18-24 year olds (33%) feel like they
would find it difficult to help someone with mental health problems, this
rises to 39% among the 25-49 and 50-64 age groups and 41% of those aged 65
and above. Overall, half of Britons (53%) say they feel well equipped to support
a loved one with their mental health, although only 9% feel “very well”
equipped to do so. (YouGov UK) October 10, 2021 711-712-43-13/Polls Nearly Three In Ten Men (28%) And One In Five Women (18%) Have Misconceptions
About Mental Health
As World
Mental Health Day approaches, YouGov data shows that stigma around
mental health is much more common among men than women. Among nine common misconceptions about mental health, men are more
likely to agree with all but two. Men – who overwhelmingly tend to dominate
senior management roles – are much more prone than women to say it’s
‘probably’ or ‘definitely’ true that people with mental health issues can’t
work or will under-perform. Nearly three in ten men (28%) believe this,
compared with one in five women (18%). In fact, most
people with mental health issues can be as productive as those not
suffering from poor mental health. Men are likewise nearly twice as likely as women to believe that
“rich people with mental health issues lack perspective and don’t know what
real problems are” at 23% to 12%. One in seven men (14%) believe people with mental health issues can
choose to stop feeling bad if they just try hard enough – a view shared only
by 4% of women. Mental illnesses are medical
conditions, influenced by biological factors, life experiences and family
history – not a mood that can change quickly. Similarly, some 12% of men say it’s ‘probably’ or ‘definitely’ true
that people with mental health issues tend to be violent and unpredictable,
while only one in 20 women (5%) agree. This is untrue –
the vast majority of people with a mental illness are not violent. Another harmful misconception that’s more prevalent among men is that
mental health problems are a sign of weakness, with 11% of men believing this
compared with only 2% of women. Separate studies show that men are less
likely to feel they have
someone to confide in and also have much
higher suicide rates. The most common misconception among Britons about mental health is
equally common among women and men, however, with respectively 39% and 37%
believing that nothing can be done to prevent mental health issues. But
according to the Mental
Health Foundation, stopping mental health problems before they start is
possible. (YouGov UK) October 10, 2021 711-712-43-14/Polls Three Quarters Of Britons (77%) Say Society Should Consider Mental
And Physical Illnesses As Equally Important
With World Mental Health Day approaching, a day aiming to remove the
stigma around mental health issues, a new YouGov survey shows that three
quarters of Britons (77%) say society should consider mental and physical
illnesses as equally important. Only 11% admit to wanting physical conditions
to take priority, and one in twenty (5%) say mental health issues should come
first. But does society actually give the two types of illnesses parity of
esteem? Britons are sceptical: only one in seven of (15%) believe that
society currently considers mental and physical health issues to be of equal
importance. Approaching two thirds of Britons (63%) say society prioritises
physical health, while 9% believe it puts mental health first. Britons see depression as more serious than
anxiety So if Britons do consider mental and physical health problems to be
equally serious, then how serious do they consider the most common mental
health problems to be? Asked as part of a question looking at attitudes to a range of 16
different ailments, 89% of Britons say they consider depression to be a
serious condition, including 45% who say it is a “very serious” condition and
a further 44% said they believe it is fairly serious. Within the range of responses, these are comparable results to HIV,
which 85% see as serious (48% very/37% fairly). It is also a similar score to
that given to other mental health issues like PTSD, eating disorders and
bipolar disorder. Anxiety, another very common mental health disorder, is generally
seen as less serious than depression. While three quarters of Britons (75%)
consider it a serious affliction, the number saying they consider it “very
serious” falls to 25%. This puts the condition close in the public mind to
issues like asthma and arthritis. From our list, the public see schizophrenia as the mental health
condition with the highest severity. Nine in ten (90%) consider it serious, including
60% who say it is very serious. Cancer came at the very top of our list, with 96% of Britons
considering it serious and including 87% who see it as very serious. This was
followed by heart disease, which 95% say is serious (73% very serious) and dementia
and Alzheimer’s disease, which 94% say is serious (72% very serious). This
trio of diseases also happen to be the
three biggest causes of death in the UK (excluding coronavirus more
recently). Younger people tend to view many physical conditions as less grave
than older Britons, with only 57% of 18-24-year-olds saying heart disease is
very serious, compared with three quarters of those aged 65+ (77%). In contrast, they are the group that’s most likely to deem common
mental health disorders as ‘very’ serious. For example, half of
18-24-year-olds (52%) classify eating disorders as such, compared with 39% of
those aged 65+. Likewise, 31% of young Britons say anxiety is highly serious,
compared with a fifth of older Brits (22%). (YouGov UK) October 10, 2021 711-712-43-15/Polls Government's Covid-19 Charity Support Fund Delivers Hope To 6.5
Million People Across Country
The Minister for Civil Society has hailed small charities as 'the
backbone of our communities', as an impact report published today reveals
that 8,200 organisations have supported an estimated 6.5 million people
during the COVID-19 pandemic, thanks to £200 million in bespoke Government
funding, distributed by The National Lottery Community Fund (NLCF). The report,
published by the Department for Digital, Culture, Media and Sport (DCMS) and
The National Lottery Community Fund (NLCF), highlights how the Coronavirus Community Support Fund has benefited
communities in every region of the country, from Cornwall and Hertfordshire
to County Durham and Merseyside. It has helped charities and social
enterprises to carry out critical work and continue protecting the most
vulnerable members of society in the wake of the pandemic. This included children and young people (supported by 39% of
grantholders), people with mental health conditions (40%) and older people
(32%). Today’s results have shown that without the £200 million fund almost
one fifth of the recipients would have been forced to close their doors,
while over half revealed that they would have delivered significantly fewer
services if it had not been for assistance from the CCSF. Over 6,200 employees of these organisations were brought back or
prevented from being furloughed, and over 4,200 new staff members were
recruited, the report estimates. This is in addition to grantholders
mobilising 136,000 existing volunteers and over 47,000 new volunteers that
they had not worked with previously. Nigel Huddleston, Minister for Civil
Society said: I’m immensely grateful for the volunteers
and charity staff who have worked tirelessly throughout the pandemic. They
have been truly heroic, and the backbone of our communities. Today’s results
demonstrate the significant role the Coronavirus Community Support Fund has played
in towns and cities across the country. As part of our wider £750 million of
direct report for charities during the pandemic, this government funding
meant organisations could continue their vital work helping more than six
million people in need. The CCSF has also played a major role in the Government’s commitment
to:
The report also underlines the positive impacts felt by the army of
volunteers who were mobilised during the pandemic. 84% of people who
volunteered through the CCSF felt like they were making a difference, and 66%
people felt it gave them a sense of purpose. Blondel Cluff CBE, Chair of The National
Lottery Community Fund, said: This report provides rich insight into the
impact that £200 million in crisis funding made. With 6.5 million people
receiving support from Coronavirus Community Support Fund grantholders, and
more than 183,000 volunteers giving up their time with Coronavirus Community
Support Fund projects, these findings help us appreciate the sheer scale of
the response and the vital role played by communities. We were proud to work
alongside Government to distribute this funding and we will use this
evaluation to continue supporting communities across the country as they
repair and rebuild following the pandemic. The Coronavirus Community Support Fund formed part of the
Government's unprecedented £750 million package of support for the sector
during the pandemic, which has benefited over 14,000 charities. (Ipsos MORI) 11 October 2021 711-712-43-16/Polls 18% Of The Britons Use Streaming Services As A Way To Follow Live
Sport
Reports this week suggest that streaming service DAZN is on the verge
of buying BT Sport for what could end up being a nine-figure sum. The move is set to send ripples across the media, telecoms and sports
worlds, setting a new benchmark for sports rights, as well as turning the
spotlight onto the ways media and telco companies can attract and retain
customers today. So, what does YouGov data tell us about the potential move? When BT Sport was originally launched in 2013, it was made available
free to BT’s broadband customers and widely perceived as a way of shoring up
the parent company’s lucrative position as an internet provider. And indeed,
if we look at BT Broadband’s customer base today, you can see that current
customers of BT Sport (defined as those who have watched the channels in the
past 30 days) are more than twice as likely to be a BT Broadband customer as
those who are not (35.8% vs 17.5%). Perhaps BT would have been more inclined to keep hold of its asset
had it won a bigger market share over the years but BT Sport has lagged
behind Sky Sports over the last 12 months, even as the sports fixture list
has returned to normal. Currently, 8.2% of consumers say they have watched BT
Sport in the past 30 days, compared to 12.9% who say they’ve watched Sky
Sports. Nevertheless, the sale is likely to suit all parties. DAZN will sweep
up all of BT Sport’s hard-won sports rights, giving the streamer a strong
foothold in a market that has so far been tough for it to crack. According to
data from YouGov Profiles, 18% of the public now use streaming services as a
way to follow live sport, making the UK sports streaming market ripe for an
experienced outfit like DAZN. Meanwhile, BT will walk away with money which it will invest in its
telco and 5G businesses. But perhaps happiest of all will be Sky Sports, who
will have seen off yet another competitor for its place at the top of the
sports broadcasting tree – it’s reported that because of cross-licensing
agreements, it will even be asked to sign off on the deal. (YouGov UK) October 12, 2021 Source: https://yougov.co.uk/topics/technology/articles-reports/2021/10/12/who-wins-dazns-deal-bt-sport 711-712-43-17/Polls Half Of The UK (47%) Say They Would Support The Government Adding A
'Green Tax' To Environmentally Damaging Goods
Despite a backdrop of rising public concern about climate change and
the environment there remain barriers to UK consumers making more sustainable
choices. Half of the UK (47%) say they would support the government adding a
'green tax' to environmentally damaging goods and two-thirds (65%) think the
government should make it compulsory for all products to include labelling on
their environmental impact. However, when asked about the government's priorities for the next
few years, investment to support reducing carbon emissions ranks lower than a
number of other issues - including funding for the NHS, social care, housing
and unemployment. Further, there is no majority opinion on whether dealing
with climate change should be prioritised at the cost of the economy (40%),
or if economic growth should be the focus at the expense of the environment
(34%).
The key barriers to making greener choices are a feeling that the
benefits of sustainable choices are not worth the costs associated with them
- a finding reinforced by the fact that 72% of the public agree that
sustainable products are too expensive for those on lower incomes. Another
important barrier is a lack of confidence in knowing what the 'right' choice
is: for instance, 49% say it is too difficult to choose a produce or service
which represents the more environmentally-friendly choice and a similar
proportion (51%) say it is too difficult to understand how damaging some
products are for the environment.
Mike Clemence, a researcher at Ipsos MORI said: The data shows that while the public are
broadly favourable towards making greener choices this does not always
translate into action – primarily due to motivational factors, such as a
feeling that the benefits gained from sustainable choices do not justify
their cost. Additionally, we see that sustainability is competing with a wide
range of other concerns people hold about the country and economy. (Ipsos MORI) 13 October 2021 Source: https://www.ipsos.com/ipsos-mori/en-uk/spending-back-sustainably 711-712-43-18/Polls A Third Of Britons (35%) Deem Alcohol ‘Very Harmful’ To The User,
While About Half (47%) Believe The Same About Its Costs To Society
Home Secretary Priti Patel announced
last month that she has ordered a review into the harm that nitrous
oxide causes, and is ready to take “tough action”. But while laughing gas,
usually consumed through balloons, is reportedly the second-most used drug among
young adults in the UK, Britons are not overly convinced about the harms when
compared with other drugs. Britons tend to view legal substances such as tobacco and alcohol as
more harmful to the user and society in general than laughing gas. Around
half of the public say tobacco is ‘very harmful’ to people who consume it regularly
(53%) and in terms of the wider cost to society (47%). Similarly, about a
third of Britons (35%) deem alcohol ‘very harmful’ to the user, while about
half (47%) believe the same about its costs to society. In contrast, only three in ten people believe laughing gas is very
damaging to the user (30%) and society (29%). Consultant psychiatrist and
addiction medicine specialist Adam Winstock, has
said that laughing gas has “minimal risks to most users”, while making it
illegal will “add the risk of criminality to all”.
Britons consider marijuana the least harmful substance among those
included in the survey, with only one in four (25%) deeming it highly
dangerous to regular users, while three in ten people (31%) say it’s very
damaging in terms of societal costs. Controversially, Professor David Nutt
has previously claimed that among a list of the most common drugs including
cocaine, ecstasy and tobacco, alcohol is the most dangerous due to its harm
to users and to others. But crack cocaine is the drug most Britons describe as ‘very harmful’
to users (90%) and in societal costs (68%). Heroin scored similarly highly on
these measures, with 88% saying it’s very damaging to users and two thirds
(67%) to society.
The public are unconvinced that banning laughing gas would achieve
much Drug experts have described the nitrous oxide ban as “completely
pointless” and a “waste of time”. The public are not convinced either: only one in four people (24%)
believe making a drug illegal is an effective way of preventing people from
taking it, while three in five (60%) say it’s ineffective. This view is consistent across party lines – 60% of Conservative
voters and 67% of Labour voters believe criminalising drugs is futile for
prevention.
If criminalising drugs is ineffective,
should they be treated more as a health issue? While the public have little faith in current drug legislations,
Britons are torn on whether drugs should be considered as more of a health or
more of a criminal issue. The most common answer is that it should be treated as both equally
(36%), while three in ten (28%) lean more towards it being viewed as a health
issue, and a quarter (24%) prefer to see it as a criminal matter. Younger people are much less inclined to say drug use should solely
be considered a criminal issue, with only 9% of 18-24-year-olds being of this
opinion. They are instead split between it being purely a health concern
(33%) or as both a health and criminal issue (32%).
In contrast, three in ten Britons aged 65+ (29%) say drug use should
be considered a criminal matter – the highest of any age group. Meanwhile, a
fifth (21%) would prefer to for it to be a health issue, while two in five
(42%) say it should be both. (YouGov UK) October 13, 2021 711-712-43-19/Polls Latest REACT-1 Study Findings Show SARS-COV-2 Infection Rates Were
Rising In Young People But Remaining Stable Overall
Findings from the latest report of REACT-1, one of the country’s
largest studies into COVID-19 infections in England, have been published
today (Thursday 14 October) by Imperial College London and Ipsos MORI. Over 100,000 volunteers took part in the study in England between 9
and 27 September 2021 to examine the levels of COVID-19 in the general
population. The latest data show that prevalence of SARS-CoV-2 (the virus
that causes COVID-19) in the population in England has increased to 0.83%. Across the period of this round of the study, the report found that
prevalence was stable or slightly rising across all age groups combined. The main findings from the 14th round of
the REACT-1 study were as follows:
The study also examined vaccine effectiveness against infection,
comparing those who have received two doses of a vaccine against those who
are unvaccinated. For all participants and all vaccines combined, vaccine
effectiveness against infection was estimated to be 62.8% when adjusted for
round, age, sex, index of multiple deprivation, region and ethnicity. Among
the subset of participants reporting symptoms, vaccine effectiveness was
66.4% overall. This is in line with estimates by UKHSA that after 2 doses, vaccine
effectiveness against symptomatic disease with the Delta variant is
approximately 65 to 70% with AstraZeneca and 80 to 95% with Pfizer-BioNTech. UKHSA estimates that the vaccination programme in England has
prevented hundreds of thousands of hospitalisations and deaths. The
vaccination programme has also been successful in weakening the link between
infection, hospitalisation and deaths. Today’s data demonstrates the need to remain vigilant and follow
government guidance to receive both doses of vaccine when you are eligible
and follow good public health behaviours to minimize spread of infection, to
ensure that we continue to reduce the risk. Dr Jenny Harries, Chief Executive of the UK
Health Security Agency, said: These data demonstrate that while our
vaccination programme continues to make a huge difference, the pandemic is
not over. As we move towards winter, it is as important as ever that we
continue to act responsibly in order to avoid transmission. While cases remain high, the vaccination programme
is ensuring that this does not translate to a similarly high number of
hospitalisations and deaths. We are urging everyone who is eligible to come
forward for vaccination. It is the best way to reduce transmission and
protect ourselves and those we love. Health and Social Care Secretary Sajid
Javid said: The phenomenal progress of our vaccination
programme has built a strong wall of defence across the country, allowing us
to live safely with this virus. These findings shows how important it is
for young people to get the jab to protect them from COVID-19, and for those
eligible to get their booster vaccine to prolong their existing protection. I urge anyone who needs one to get a jab as
soon as possible – it’s vital to keep you and your family safe this winter. Professor Paul Elliott, director of the
REACT programme from Imperial’s School of Public Health, said: Our latest data show that infections are
high and rising in school-aged children. Households with children also had a
higher prevalence of infection, suggesting that children may be passing on
the virus to those that they live with. These trends reinforce how important
it is for children aged 12 and above to get vaccinated and help curb the
spread of infection, and minimise disruption to education. Kelly Beaver, Managing Director, Public
Affairs at Ipsos MORI said: While the rise since our last REACT-1 round
in prevalence is concerning, it is encouraging that there has not been a
commensurate rise in hospitalisations and deaths from COVID-19. The R number
for under-18s is particularly encouraging, allowing children to spend more
time in school learning. Ipsos MORI is incredibly grateful to all
those who have taken part in the REACT studies since April last year who have
played a vital role in helping the Government understand the virus and how it
has spread. (Ipsos MORI) 14 October 2021 711-712-43-20/Polls The Liberal Democrats Are Only Currently Holding On To Half Of Their
2019 Voters (51%)
Almost two years since the last general election, and with the next
election not scheduled until 2024, the Conservative lead remains stubbornly
strong (notwithstanding a blip around the announcement of the social care
levy). With Parliament set to re-open next week following conference recess,
YouGov has compiled all of our voting intention surveys in September –
totalling some 24,000 respondents – to take a detailed demographic look at
where the electorate stands. 2019 general election vote Both major parties are holding onto the large majority of their 2019
voters – the Conservatives are retaining 83% of those who voted for them last
time, while for Labour it is 77%. Very few voters are switching between the
two parties, with just 3% of 2019 Labour voters saying they now favour the
Conservatives, and 5% going the opposite way. The biggest drain on the 2019
Labour vote is from the Greens, who are currently attracting one in nine
(11%) of this group. The Liberal Democrats are only currently holding on to half of their
2019 voters (51%). Labour are the main benefactory, picking up a quarter of
these voters (27%) while the Greens (10%) and Conservatives (9%) also
benefit. As well as picking up votes from elsewhere, the Greens are
holding on to 72% of their 2019 vote – impressive given smaller parties tend
to experience more churn during election cycles. The figures discussed above exclude those who are unsure how they’d
vote in an election or say they will not vote. This is referred to as
headline voting intention. However, outside of an election campaign a large
number of the public say “don’t know” – at the moment this figure is at 19%
for all adults. This figure differs by party, with one in five (19%) 2019
Conservative voters currently saying they don’t know how they’d vote,
compared to 15% of 2019 Labour voters. It is far easier to win back those who
are currently saying they’re unsure how they’ll vote than those who say they
now support a different party. In 2017, after Theresa May announced a snap
election, many undecided voters who’d backed Labour in 2015 eventually
returned to the party, helping boost their headline voting intention in the
polls. To get the full picture it is therefore useful to keep an eye on
differential “don’t knows” amongst parties as well as the headline figures. EU referendum vote Between the 2017 and 2019 general elections, we saw Labour losing a
lot of Leave voters and the Conservatives losing Remain voters. For example,
the Tories kept hold of 92% of their 2017 voters who also voted Leave at the
2019 election, but only 65% of their 2017 voters who backed Remain. This Brexit realignment now seems to have run its course, with both
parties keeping the same proportion of 2019 voters regardless of whether they
voted Leave or Remain. Where their lost voters have gone does vary by
referendum vote though. Labour have lost 9% of their 2019+Leave voters to the Conservatives
compared to just 2% of their 2019+Remain voters. Twice as many of their
Remain voters are going to the Greens (13%) as their Leave voters (7%). One
in twelve Conservative 2019+Leave voters (8%) have moved to Reform UK,
compared to 2% of their 2019+Remain voters. Age and work status Age remains a dividing line in British politics – the older someone
gets, the likelihood they will be a Conservative voter increases and the
chance they’ll be a Labour voter decreases. Just 15% of 18-24 year olds
intend to vote Conservative at the next election, compared to 61% of those
aged 70+. Labour pick up half (49%) of the 18-24 vote share, while only one
in six of those aged 70 and above intend to vote for them (17%). The Green Party are also far more likely to attract younger voters,
picking up 14% of the under 25 vote compared to 4% of those aged 70 and
above. The Liberal Democrats’ vote remains fairly constant across age groups. Heavily linked to age, the differences between the working and
retired population are also stark. Those in work split 37% voting Labour to
33% voting Conservative. In contrast, retired adults are more than twice as likely
to vote Conservative as Labour (56% vs 21%). There is very little difference
in how full time and part time workers are voting. Social grade and education level The Conservatives remain ahead across social grades, but the gap is a
lot closer among those who are more middle class. AB and C1 voters both
marginally break to the Conservatives over Labour by 36% to 34%. C2 voters
split 43% to 30% to Conservatives while for DE voters it is 39% to 33%. The differences in voting depending on someone’s education are far
larger than those for different social grades. Twice as many of those whose
highest attained qualification is GCSE (or equivalent) are voting
Conservative than Labour (51% to 26%), while amongst those who hold a degree
this is almost reversed (41% are voting Labour, 25% Conservative). The
Liberal Democrat vote share also differs a lot depending on education level
with 12% of those in the high education level category voting for the party
compared to 5% in the low group. Education is heavily correlated with age as younger people far more
likely to have attended university. However, when we look at education level
split by older and younger people there are still notable differences.
Amongst under 40s with a low education level, Labour have a 10-point lead
over the Conservatives (39% to 29%) while for those with a degree the gap is
21-points (Labour 42%, Conservatives 26%). Amongst those aged 40 and above,
the Conservatives are on 52% with the low education level group, 30 points
ahead of Labour on 22%. While still ahead amongst the higher education level
group, their lead is narrower (12 points) with the Conservatives on 41% and
Labour on 29%. (YouGov UK) October 15, 2021 Source: https://yougov.co.uk/topics/politics/articles-reports/2021/10/15/how-britain-voting-autumn-2021 711-712-43-21/Polls Two In Five Brits (40%) Say They Have The NHS COVID-19 App Installed
On Their Phones
Following the easing of COVID restrictions across the UK, it is no
longer a legal requirement for businesses to make sure their patrons check-in
via the NHS COVID-19 app. However, businesses are still being encouraged by
the government to display the app’s QR codes to allow customers to check-in
if they want to – but how many Britons have kept the app in the first place? Currently, two in five Brits (40%) say they have the app installed on
their phones, down from 47% in mid-July. Approaching a fifth of the general
public have deleted the app from their phones (19%). This means that almost a
third of people who have ever had the app have now deleted it, almost twice
the rate it was in July. Younger Britons (18-24-year-olds) are the most likely to have done
away with the app: 29% have done so, compared to 13% of those aged 65 and
above. Of those still with the app installed, many
haven’t used it for weeks While plenty of Brits still have the app installed, without the
mandate to actively use it many are not doing so. Approaching half (49%) of those with the app say it has been over a
month since they used it to check in to a venue or location, while 18% say
they have never done so. Only 9% of the app’s users say they had checked into
a venue in the week before the survey was conducted, Britons aged 65 and over with the app are the most likely to say they
have used it within the last month to check into a venue (35%) compared to
26% of those aged between 25 and 49. (YouGov UK) October 15, 2021 711-712-43-22/Polls Most French People Have An Aperitif With Their Family (56%)
The aperitif is a moment of sharing particularly appreciated by the
French. Indeed, 74% of
them say they take an aperitif at
least once a month , and 49% at least once a week. The 25-34 year olds seem to be the greatest followers: 57% say they
take an aperitif at least once a week (significantly more than the national
population). YouGov carried out a RealTime study
in order to learn more about this moment of consumption implanted in the
daily life of the French. Who do the French take an aperitif with? Most French people have an
aperitif with their family (56%) . In addition, 46% are
used to doing it with friends, 40% with their partner and 8% with
colleagues. It should also be noted that more than one in ten people are
used to having an aperitif alone (12%). Privileged places The majority of French people who take an aperitif are used to doing
so at home (82%), or with relatives (52%). What are they consuming?
Overall, savory products are more successful than sweet
products. In fact, savory
aperitif biscuits come first (64%), followed by aperitif
seeds (59%) and crisps (53%). Regarding the preferred chip flavors, the French remain fairly
traditional: the natural taste is the favorite among consumers of chips or
aperitif biscuits (41%). The barbecue (15%) and cheese (12%) flavors
come in 2 nd and 3 rd place
respectively. Note: among 18-34 year-olds, plain taste retains first place but is
significantly less successful (31%). Barbecue is also in second position
(21%), this time followed by the chicken flavor which registers a score of
13% among this population (vs. 6% nationally).
At the national level, alcoholic drinks remain largely preferred
during the aperitif ( 84% with
alcohol vs. 41% without
alcohol). On the other hand, we observe that this tendency is much less strong
among young people: 72% declare having the habit of consuming alcoholic
drinks and 69% of non-alcoholic drinks. The wine is
the beverage which emerges most in French taking a drink ( 41% ). Beer (36%) and strong
alcohol (28%) complete the Top 3 drinks consumed. To note :
Which brands are most viewed by consumers? By plugging this study into YouGov
Profiles - our media
segmentation and targeting tool - we were able to highlight
the brands of crisps / crackers and the brands of beer most considered by
consumers of this type of product at the time of the review. 'aperitif. (YouGov France) October 13, 2021 Source: https://fr.yougov.com/news/2021/10/13/les-francais-et-l-aperitif/ NORTH
AMERICA
711-712-43-23/Polls About Eight-In-Ten US Hispanics (81%) Say Addressing Global Climate
Change Is Either A Top Concern Or One Of Several Important Concerns To Them
Personally
Most Latinos in the United States say global climate change is an important
concern, with a majority saying that it affects their local community at
least some. Latinos broadly support an array of policy measures to address
climate change and other environmental issues. And many say they are willing
to help by making lifestyle changes, according to a Pew
Research Center survey. About eight-in-ten U.S. Hispanics (81%) say addressing global climate
change is either a top concern or one of several important concerns to them
personally, with 39% saying it is a top personal concern. By comparison, a
lower share of non-Hispanics (67%) say addressing global climate change is at
least one of several important concerns, due in large part to a lower share
who say it is a top concern (29%). In addition, a greater share of
non-Hispanics than Hispanics say addressing global climate change is not an important concern to them
(32% vs. 18%). For Hispanics, climate change is not just a global, distant concern.
About seven-in-ten Hispanic adults (71%) say climate change is affecting
their local community at least some, a higher share than among non-Hispanic
adults (54%), the April survey of U.S. adults found. Some notable differences exist across demographic subgroups, in
particular among Latino partisans. The vast majority (81%) of Latino
Democrats and Democratic-leaning independents say global climate change is
affecting their local community, with roughly one-third (32%) saying the
impact is affecting their community a great deal. By contrast, about half
(52%) of Latino Republicans and Republican leaners say global climate change
affects their local community at least somewhat, with just 14% saying it is
having a great impact. Meanwhile, one-in-five Latino Republicans say global
climate change does not affect their community at all, a view shared by only
2% of Latino Democrats. Hispanic adults’ views on the local effects of climate change also
vary by nativity. Among Hispanics born in another country, Puerto Rico, or
another U.S. territory, about eight-in-ten (79%) say global climate change
affects their local community a great deal or some, while 64% of Hispanics
born in the 50 states or the District of Columbia say the same. The share
increases to 87% among foreign-born Hispanics who have been in the U.S. for
20 years or less, with over a third (36%) saying global climate change
affects their community greatly. By comparison, a quarter or less of
Hispanics born in the 50 states or D.C. and foreign-born Hispanics who have
lived in the country for 21 years or more (22% and 25%, respectively) say the
same about their local communities. Experiences that foreign-born Latinos had in places they lived before
moving to the 50 states or D.C. may shape their views on climate change. As
climate change makes extreme weather events more common globally, more people
leave their homes, according to a 2018 report by the World Bank.
Latin America – especially Central
America – has been among the top sources of climate migration in
recent years. The report estimates the region could see up to 17
million people migrate due to climate change by 2050. More Hispanics than non-Hispanics say certain environmental issues
are a big problem in their local communities. In the survey, participants
were asked to assess how big a problem each of the following environmental
issues is in their local community: too much garbage, air pollution,
pollution of lakes, rivers and streams, safety of drinking water, and lack of
parks and greenspace. The largest differences between Hispanics and non-Hispanics came on
air pollution (70% vs. 49%) and safety of drinking water (56% vs. 38%).
Hispanics (along with other non-White racial and ethnic groups) are
disproportionately affected by air
pollution, and are less likely to have access to drinking water that
meets federal
health standards, according to research by public health experts, climate
scientists and social scientists. The survey also found that a majority (56%) of U.S. Hispanics say
that the area where they live has experienced an extreme weather event within
the last year. California, Texas and Florida are home to more than half of
the country’s Hispanic population, and each state’s Hispanic population increased
by more than 1 million from 2010 to 2020. These states and others
have also experienced an increase in wildfires, extreme
heat, drought and flooding in
recent years. Hispanics say addressing global climate change is a priority.
Overall, 75% of Hispanics say reducing the effects of global climate change
needs be a “top priority to ensure a sustainable planet for future
generations, even if that means fewer resources for addressing other
important problems today,” with 62% of non-Hispanics saying the same. However, when asked how much they think the U.S. federal government
is doing to address climate change, about two-thirds (67%) of Hispanics say
the government is doing too little, a view widely shared across most
demographic subgroups. Hispanics also express more concern than non-Hispanics about what the
federal government is doing to protect the environment on a number of
specific issues. For example, roughly two-thirds (65%) of Hispanics say the
federal government is doing too little to protect air quality, compared with
57% of non-Hispanics. Nearly all Latinos (93%) say protecting the quality of the
environment for future generations is very or somewhat important to them when
thinking about proposals to reduce the effects of global climate change. This
echoes previous findings from Pew Research Center’s National
Surveys of Latinos, which found Latinos are concerned about the financial
and overall well-being of their children and future generations. Hispanics are also more likely than non-Hispanics to think human
activity, such as the burning of fossil fuels, contributes some or a great
deal to global climate change (84% vs. 76%). This includes Hispanics being
more likely to say human activity contributes a great deal to climate change (52%). Latinos’ views vary among some subgroups, in particular by political
party affiliation. Almost two-thirds (65%) of Latino Democrats say that human
activity contributes a great deal to global climate change, compared with
one-in-four Latino Republicans. Meanwhile, about two-thirds (66%) of
foreign-born Latinos who have been in the U.S. for 20 years or less say that
human activity contributes a great amount to climate change, compared with
about half of foreign-born Latinos who have lived in the U.S. for 21 years or
more and U.S.-born Latinos (49% and 48%, respectively). Many Latinos are adjusting their daily habits to protect the
environment. Majorities say they have taken several types of action in their
everyday lives to help protect the environment, from reducing food waste
(83%) to using less single-use plastic and less water (76% each).
Additionaly, a majority of Latinos say they are taking action: Around eight-in-ten
(82%) say they are making an effort at least some of the time to live in ways
that help protect the environment, including roughly one-in-five (21%) who
say they make an effort all of the time. Some Hispanics are also hearing encouragement to get engaged in
climate change efforts from those around them. Roughly three-in-ten (31%) say
a friend or family member has encouraged them to become more involved in
efforts to reduce the effects of global climate change. Many say inspiration
is also coming from younger Hispanics. Half (50%) of Hispanics say seeing
younger adults urging action on global climate change generally makes them
more interested in addressing climate change themselves. (PEW) OCTOBER 4, 2021 711-712-43-24/Polls Rising Share of U S Adults Are Living Without a Spouse or Partner
As relationships, living
arrangements and family
life continue to evolve for American adults, a rising share are not
living with a romantic partner. A new Pew Research Center analysis of census
data finds that in 2019, roughly four-in-ten adults ages 25 to 54 (38%) were
unpartnered – that is, neither married nor living with a partner.1 This
share is up sharply from 29% in 1990.2 Men
are now more likely than women to be unpartnered, which wasn’t the case 30
years ago. The growth in the single population is driven mainly by the decline
in marriage among adults who are at prime working age. At the same
time, there has been a rise in the share who are cohabiting, but it hasn’t
been enough to offset the drop in marriage – hence the overall decline in
partnership. While the unpartnered population includes some adults who were
previously married (those who are separated, divorced or widowed), all of the
growth in the unpartnered population since 1990 has come from a rise in the
number who have never been married. This trend has broad societal implications, as does the growing gap
in well-being between partnered and unpartnered adults. Looking across a
range of measures of economic and social status, unpartnered adults generally
have different – often worse – outcomes than those who are married or
cohabiting. This pattern is apparent among both men and women. Unpartnered
adults have lower earnings, on average, than partnered adults and are less
likely to be employed or economically independent. They also have lower
educational attainment and are more likely to live with their parents. Other
research suggests that married and cohabiting adults fare better than those
who are unpartnered when it comes to some health
outcomes. The gaps in economic outcomes between unpartnered and partnered
adults have widened since 1990. Among men, the gaps are widening because
unpartnered men are faring worse than they were in 1990. Among women,
however, these gaps have gotten wider because partnered women are faring
substantially better than in 1990. The growing gap in economic success between partnered and unpartnered
adults may have consequences for single men who would like to eventually find
a partner. In a 2017
Pew Research Center survey, 71% of U.S. adults said being able to support
a family financially is very important for a man to be a good spouse or
partner. Similar shares of men and women said this. In contrast, 32% of
adults – and just 25% of men – said this is very important for a woman to be
a good spouse or partner. A growing share of adults are unpartnered Americans’ marital and living arrangements have changed considerably
over the past 30 years. The share of adults ages 25 to 54 who are currently
married fell from 67% in 1990 to 53% in 2019, while the share cohabiting more
than doubled over that same period (from 4% in 1990 to 9% in 2019).3 The
share who have never been
married has also grown – from 17% to 33%. All of this churn has resulted in a
significant increase in the share who are unpartnered. The growth in unpartnered adults has been sharper among men than
women. In 1990, men and women ages 25 to 54 were equally likely to be
unpartnered (29% of each group). By 2019, 39% of men were unpartnered,
compared with 36% of women. In terms of their demographic characteristics, prime-working-age
single adults are somewhat younger than their counterparts who are married or
living with a partner. Among adults ages 25 to 54, the median age of those
who are unpartnered was 36 in 2019; this compares with 40 among partnered adults. Some may assume that, as the median
age of first marriage continues to rise, unpartnered adults are
merely lagging behind rather than foregoing partnership altogether. That
might not be the case. Among adults ages 40 to 54, there has been a
significant increase in the share who are unpartnered from 1990 (24%) to now
(31% in 2019). There are differences by race and ethnicity in the share of
prime-working-age adults who are partnered and unpartnered. Among those ages
25 to 54, 59% of Black adults were unpartnered in 2019. This is higher than
the shares among Hispanic (38%), White (33%) and Asian (29%) adults. For most
racial and ethnic groups, men are more likely than women to be unpartnered.
The exception is among Black adults, where women (62%) are more likely to be
unpartnered than men (55%). Partnership status also differs by nativity. Foreign-born adults at
prime working age were less likely (28%) to be unpartnered in 2019 than their
native-born peers (40%). This pattern is apparent among adults of each major
racial or ethnic origin. For example, 29% of foreign-born Hispanic adults
were single, compared with 46% of native-born Hispanic adults. Some of this
difference in partnership status may reflect that foreign-born
prime-working-age adults are older than their native-born counterparts. On average, unpartnered adults have worse
economic outcomes than partnered adults On a variety of outcomes, be it education, employment or living
arrangements, unpartnered adults fare differently than partnered adults.
Because the size of the gap associated with partnership differs between men
and women, results are presented separately for both genders. When it comes to educational attainment, 26% of unpartnered
prime-working-age men had completed at least a bachelor’s degree in 2019.
This markedly trails the 37% of partnered men who had finished college.
Similarly, 33% of unpartnered women in 2019 had finished at least a bachelor’s
degree, compared with 43% of partnered women. Outcomes differ for married, cohabitating
and unpartnered adults This analysis is based on the premise that adults who live with a
romantic partner – whether they are married or cohabitating – have significantly
different (often better) economic outcomes than those who are not living with
a romantic partner. But it’s important to note that outcomes also differ
between married and cohabiting adults. Cohabiting adults tend to fare better than unpartnered adults, and
married adults fare better still. On many dimensions, cohabiting adults are
more similar to married adults than to single adults. There are exceptions as
well as differences by gender. For example, among women, those in cohabiting
relationships (80%) are more likely to be employed than unpartnered (77%) or
married (73%) women. Among men, while those who cohabit (89%) are less likely
to be employed than those who are married (92%), they’re much more likely
than single men to have a job (73%). Since a relatively small share of adults ages 25 to 54 are cohabiting
(9%), combining them with married adults to paint a fuller picture of those
who are living with a romantic partner does not markedly change the size
or the direction of the gaps that exist between partnered and unpartnered
adults. (See Appendix A for a detailed breakdown.) The economic outcomes of prime-working-age men differ substantially
by partnership status. In 2019, 73% of men without a partner were employed,
compared with 91% of partnered men. The gap in employment among women, which
is more modest, goes in the opposite direction: 77% of single women held a
job in 2019, compared with 74% of women with a partner. In 2019, the median earnings of men without a partner were $35,600,
lagging far behind those of partnered men ($57,000).4 Unpartnered
women also trail their partnered counterparts in median earnings ($32,000 and
$40,000, respectively), but the gap is not as large. Another measure of economic standing compares an individual’s income
with a threshold of the resources needed to live independently.5 In
this analysis, an income of 150% of the official poverty level for a
one-person household ($19,950 based on a poverty cutoff of $13,300 in 2019)
is used as a benchmark for living independently. Adults whose total income is
below this threshold are considered “financially vulnerable.” In 2019, 36% of unpartnered men would have been considered
financially vulnerable based on their individual income. This is nearly three
times the share of partnered men with vulnerable incomes (13%). In contrast,
there was little difference in the share of unpartnered and partnered women
who were financially vulnerable (37% and 38%, respectively). The parity among
women partly reflects the differing child care responsibilities of partnered
versus unpartnered women. As reported below, partnered women are about twice
as likely as their unpartnered counterparts to live with one or more of their
own children, and mothers are generally less likely to work full-time and
full-year. There are stark differences in the living arrangements of partnered
and unpartnered prime-working-age adults, particularly among men. Roughly
three-in-ten unpartnered men (31%) lived in the home of at least one of their
parents in 2019. Among men who were married or cohabiting, only 2% of them
resided in the home of their parent(s). Some of the gap reflects that
unpartnered men tend to be younger than partnered men. However, even when
looking only at unpartnered men ages 40 to 54, a sizable share (20%) lived in
their parent(s)’ home. About a quarter (24%) of unpartnered women lived with at least one
parent in 2019 (compared with only 2% of partnered women). As of 2019, 5% of unpartnered men resided in institutionalized group
quarters. (For adults of prime working age, this largely refers to adult
correctional facilities.) This compares with 1% of partnered men. The share
of women who were living in an institutional setting (whether they are
partnered or not) was extremely low – 1% for unpartnered and fewer than 1%
for partnered women. Not surprisingly, unpartnered adults are much less likely than
partnered adults to have a child of their own in their household. Among men,
8% of the unpartnered lived with a child of their own in 2019. (This includes
stepchildren and adopted children as well as biological children.) Among
partnered men, 61% were living with at least one child. The gap is smaller
among women: Roughly a third of unpartnered women (32%) lived with at least
one child, compared with 60% of partnered women. Researchers have considered why this relationship between partnership
status and economic outcomes exists, particularly for men. Is it driven by
the fact that men with higher levels of education, higher wages and better
prospects for the future are more desirable potential spouses? Or is there
something about marriage or partnership that gives a boost to a man’s
economic outcomes? The research suggests that both factors are at play. Married
men earn more because high earners are more likely to marry in the
first place. Cohabiting
men also receive a wage premium. In addition, marriage or
partnership may
make men more productive at work, thus adding to the wage premium
that already exists. Less attention has focused on the benefits of partnership for women,
but marriage and cohabitation are associated with wage
gains for childless women. The effects may be more modest for women, but
marriage benefits men’s and women’s wages through similar processes. Since 1990, worse outcomes for unpartnered
men and better outcomes for partnered women The economic gap between single and partnered adults has generally
grown wider since 1990, though exceptions exist. The change has been greater
on some measures among women than men, and the dynamics underlying the shifts
reflect different realities for each group. For women the gaps have widened
not because unpartnered women are faring worse now than 1990, but rather
because partnered women have experienced significant improvements in their
outcomes. In contrast, the economic gap between unpartnered and partnered men
has widened mainly because the former are faring worse on most indicators. In 1990, similar shares of unpartnered (23%) and partnered (22%)
women had completed at least a bachelor’s degree. Both groups have improved
their educational attainment, but partnered women have made greater strides.
By 2019, 43% of partnered women were college graduates, resulting in a
significant gap in educational attainment between the two groups. Partnered women have closed some of the gap in employment with single
women. In 1990, single women were significantly more likely to be working
than partnered women. Employment has increased among both groups, but
especially among partnered women – a 7 percentage point gap has narrowed to 3
points. This is due in large part to the growing share of mothers who have
entered the labor force since 1990. In 1990, unpartnered women at the median out-earned their partnered
counterparts ($32,300 vs. $26,900). Unpartnered women’s median earnings have
since remained stagnant, while partnered women’s median earnings have
increased by $13,100. A $5,400 gap in favor of single women has reversed and
as of 2019 had become an $8,000 earnings gap in favor of partnered women. Relatedly, the income received by partnered women has increased
substantially since 1990, and far fewer of them lack the resources to live
independently. The share of single women who are financially vulnerable has
not changed much (from 38% in 1990 to 37% in 2019). When it comes to living arrangements, compared with 1990, a
significantly higher share of single women now reside with at least one
parent, so the gap on this score between single and partnered women has
widened (from 16 to 23 percentage points by 2019). Differences in the shares of single and partnered women who are
living with a child have not changed substantially. Both groups were slightly
less likely to have a child in their household in 2019 than in 1990. Turning to men, single men have made only minimal gains in
educational attainment since 1990. By 2019, 26% of single men had completed
at least a bachelor’s degree, up from 24% in 1990. Educational gains have
been much more substantial for partnered men over this period. The share who
had completed at least a bachelor’s degree rose 11 percentage points from
1990 to 2019, increasing the educational gap between partnered and
unpartnered men from 3 to 11 percentage points. Single men have fallen further behind their partnered counterparts
educationally at a time when job opportunities for less-educated men in the
U.S. labor market have become more limited. This is reflected in trends in
employment and earnings. Many studies have documented rising
joblessness among less-educated men of prime working age accompanied
by falling real wages since
1980. There is less consensus on the factors contributing to these declining
fortunes, but explanations usually include those involving both the demand
for less-educated workers and the supply. Unpartnered men were less likely to be employed in 2019 (73%) than
they were in 1990 (76%).6 Consequently,
a 16 percentage point gap in job holding between single and partnered men has
widened somewhat to 18 points. The gap in earnings has widened even more.
Single men are the only one of the four demographic groups to have
experienced a significant decline in their inflation-adjusted median
earnings. The typical earnings of unpartnered men have fallen by $1,500 since
1990. Combined with the earnings gains among partnered men, the earnings gap
between single and partnered men widened from $16,200 in 1990 to $21,400 in
2019. As is the case among women, unpartnered men are more likely now to be
living with a parent than they were in 1990, while the share of partnered men
doing so has remained about the same. Some 31% of single men lived with a
parent in 2019, up from 27% in 1990. The gap in the share of men who are
institutionalized has widened over this period. When it comes to living with children, 8% of unpartnered men did so
in 2019, compared with 61% of partnered men. The gap between the two groups
of men has narrowed somewhat over the past 30 years but remains quite
large. (PEW) OCTOBER 5, 2021 711-712-43-25/Polls Two-Thirds Of Republicans Want Trump To Retain Major Political Role;
44% Want Him To Run Again In 2024
Two-thirds of Republicans and Republican-leaning independents say
they would like to see former President Donald Trump continue to be a major
political figure for many years to come, including 44% who say they would
like him to run for president in 2024, according to a Pew Research Center
survey of U.S. adults conducted Sept. 13 to 19. About one-in-five Republicans (22%) say that while they would like
Trump to continue to be a major political figure in the United States, they
would prefer he use his stature to support another presidential candidate who
shares his views in the 2024 election rather than run for office himself.
About a third of Republicans (32%) say they would not like Trump to remain a national
political figure for many years to come. The share of Republicans who say Trump should continue to be a major
national figure has grown 10 percentage points – from 57% to 67% – since a
January survey that was conducted in the waning days of his administration
and in the immediate wake of the Jan. 6 riot at the U.S. Capitol. Views among Democrats and Democratic-leaning independents are
essentially unchanged over this time period. Today, 92% of Democrats say they
would not like to see Trump continue to be a major national political figure
in the future, while just 7% say they would like to see this. Among Republicans, views on whether Trump should continue to be a
major political figure or run for office in the next presidential election
vary by age, education and ideology. For example, 72% of Republicans with some college experience or less
(who
make up a clear majority of Republicans) say Trump should be a major
figure, with half saying he should run for president in 2024. By contrast, a
narrower majority (54%) of Republicans with a college degree or more say
Trump should remain a prominent figure, including just 28% who say he should
run for office in the next presidential election. Among conservative Republicans, there is widespread support for Trump
remaining a national political figure: Three-quarters prefer this, including
49% who say he should run for president again in 2024. Moderate and liberal
Republicans are more divided: 51% say he should play an ongoing political
role, with 33% saying he should run for president himself in 2024; 47% say he
should not continue to play a major political role. Nearly two-thirds of Republicans say their
party should not be accepting of elected officials who criticize Trump A 63% majority of Republicans say their party should be not too (32%)
or not at all (30%) accepting of elected officials who openly criticize
Trump, according to the new survey. Just 36% of Republicans say the GOP
should be very (11%) or somewhat (26%) accepting of officials who do so. By contrast, about six-in-ten Democrats say the Democratic Party
should be very (17%) or somewhat accepting (40%) of Democratic elected
officials who openly criticize President Joe Biden. Majorities of Republicans and Democrats alike say their party should
be accepting of elected officials who agree with the other party on important
issues. Two-thirds of Democrats say the Democratic Party should be accepting
of Democratic officials who agree with the GOP on important issues. A slimmer
majority of Republicans (55%) say the GOP should be accepting of officials
who agree with Democrats on some important issues. The survey also asked about the acceptability of elected officials
from one party calling their counterparts in the other party “evil.” A
majority of Democrats (57%) and about half of Republicans (52%) say their
parties should be not too or not at all accepting of officials who do this. About four-in-ten Democrats (41%) say their party should be accepting of elected
officials in their own party who call GOP officials evil, with 13% saying
their party should be very accepting of this. Among Republicans, 46% say
their party should be accepting of officials who call their Democratic
counterparts evil, including 18% who say the party should be very accepting
of these officials. The share of Republicans who say their party should be accepting of
elected officials who openly criticize Trump has declined since March. Today,
36% of Republicans say it is at least somewhat acceptable for Republican
elected officials to openly criticize Trump, down from 43% earlier this year. There has also been a decline in the share of Democrats who say their
party should be accepting of Democratic elected officials who openly
criticize Biden. A narrow majority of Democrats (57%) say this is acceptable,
down from 68% in March. (PEW) OCTOBER 6, 2021 711-712-43-26/Polls Two-Thirds Of U S Catholics Unaware Of Pope’s New Restrictions On
Traditional Latin Mass
Pope Francis’ decision to impose new
restrictions on the traditional Latin Mass in July drew a strong
reaction from Catholics in the United States. While some Catholics
welcomed the news, others criticized the pontiff, saying the revival of the
Latin Mass in recent years has been key
to rejuvenating the faith of younger Catholics. Despite the controversy, most U.S. Catholics are unaware of Pope
Francis’ recent actions, with roughly two-thirds saying they have heard
“nothing at all” about the new restrictions, according to a Pew Research
Center survey of adults conducted Sept. 20-26, 2021. But there are pockets of
opposition to the new rules, with weekly Mass-goers and Catholic Republicans
expressing higher levels of disapproval than those who do not go to Mass
regularly and Catholic Democrats. Nevertheless, Francis remains a very
popular figure among American Catholics, with about eight-in-ten continuing
to express a favorable view of the pope, little changed since March. Most Catholics around the world attend Masses conducted in the
vernacular (or local language), but some prefer the traditional Latin version
that was used for centuries prior to the Second Vatican Council. In 2007,
Francis’ predecessor, Pope Benedict XVI, expanded access to the traditional
Latin Mass by allowing priests to use the older form “without any further
permission from the Vatican” or their bishop, according to Catholic
News Service. Francis said in July that the new limitations, which
reverse Benedict’s move, are designed to promote unity within the Church. Francis’ decision requires priests currently using the traditional
Latin rite to “request authorization from their bishop to continue doing so,”
according to Catholic News Service. The new rules also require bishops to “determine
if the current groups of faithful attached to the old Mass accept Vatican
II,” and forbid bishops from authorizing “the formation of any new pro-Latin
Mass groups in their dioceses,” The
Associated Press reported. Overall, 65% of U.S. Catholics say they have heard “nothing at all”
about the pope’s decision to impose new limits on the use of the traditional
Latin Mass. About three-in-ten of those surveyed (28%) have heard “a little”
about the change, and 7% say they have heard “a lot” about it. All the survey respondents who indicated they have heard at least a
little about the new limitations received a follow-up question asking whether
they approve or disapprove of the pope’s decision. Their opinions are divided
about evenly between those who approve (9% of all Catholics) and those who
disapprove (12% of all Catholics) of Francis’ actions. An additional 14% of
U.S. Catholics say they have heard at least a little about the change, but
either have no opinion on it or declined to give their opinion. Catholics who attend Mass weekly are both more likely to be aware of
the new restrictions and more inclined to oppose them than Catholics who
attend less frequently, the survey finds. Nearly six-in-ten Catholics who attend Mass weekly or more often have
heard at least a little about the new restrictions, and roughly three-in-ten
say they disapprove of them. By contrast, just 7% of Catholics who attend
Mass once or twice a month or a few times a year disapprove of the pope’s
decision, as do 6% of Catholics who rarely or never go to church. Majorities
in both of these groups say they have not even heard about the new rules. Political affiliation also is tied to views about the new Mass
guidelines. Catholics who identify with or lean toward the Republican Party
are roughly three times as likely as Catholic Democrats or Catholics who lean
toward the Democratic Party to oppose the new rules (20% vs. 6%), though
majorities in both groups say they are unfamiliar with the issue. There is little difference on these questions by age, although
Catholics ages 50 and older are slightly more likely than younger Catholics
to have heard about the issue, and to say they have no opinion about it.
Meanwhile, views of Pope Francis have remained fairly steady among
U.S. Catholics recently, even within segments of the Catholic community that
express higher-than-average disapproval of the new rules about the traditional
Latin Mass. Overall, 83% of U.S. Catholics say they have a favorable view of Pope
Francis, compared with just 14% who express an unfavorable view of him.
That’s little changed from March 2021 (82% vs. 14%, respectively). Surveys prior to February 2020 were conducted by telephone, while
later ones used a representative sample of Americans conducted on the
Center’s online American Trends Panel. (For a discussion of the impact of
switching from telephone survey administration to web surveys for measuring
attitudes about Pope Francis, see “Americans,
including Catholics, continue to have favorable views of Pope Francis.”) Among U.S. Catholics who say they attend Mass at least weekly, 83%
express a favorable view of Pope Francis, virtually indistinguishable from
the 84% who said this in March. And among Catholic Republicans, 71% now
express a favorable view of him, little changed from the 73% who said the
same in March. The study continues to find political polarization in the way
Catholics view the pope: The share of Catholic Democrats who have a favorable
view of Francis is 20 percentage points higher than it is among Catholic
Republicans. Political polarization also extends to views about Pope Francis’
personal characteristics. Catholic Republicans are less inclined than Catholic Democrats to say
“yes” when asked whether positive words like “compassionate,” “humble” and
“open-minded” describe Pope Francis – though majorities of Catholics in both
parties say the pope does embody
these traits. And Catholic Republicans are more likely than Catholic Democrats to
ascribe certain negative attributes, including “out of touch” and “naive,” to
Pope Francis. Nearly half of Catholic Republicans say Pope Francis is “too
liberal” (49%), while just 16% of Catholic Democrats say this. There is also
a difference in how Catholic Republicans and Democrats view the state of the
pope’s health. In July, before Francis announced the new rules about the
traditional Latin Mass, he underwent
surgery to remove half his colon and spent 10 days in the hospital. By a 57% to 34% margin, the majority of Catholic Democrats say they
think Francis is “in good physical health.” But Catholic Republicans are
divided on this question, with 45% saying they think the pope is in good
health and 49% saying they don’t think so. (PEW) OCTOBER 7, 2021 711-712-43-27/Polls States Have Mandated Vaccinations Since Long Before Covid-19
Many Republican governors reacted
furiously after President Joe Biden said he would require
employees at large businesses to either get vaccinated against
COVID-19 or submit to weekly testing. But Republican- and Democratic-led
states alike already require hundreds of thousands of their citizens –
infants, toddlers and schoolchildren, mostly – to be vaccinated against a
panoply of diseases. In fact, mandatory childhood immunizations have been a
feature of American society since the 19th century. Currently, the Centers for Disease Control and Prevention’s Advisory
Committee on Immunization Practices recommends routine vaccination against 16
diseases from birth through age 18. The CDC recommendations, in turn, inform
individual states’ vaccine mandates: Typically, children who haven’t received
the required shots for their age can’t attend school (public, private or
parochial) or enroll in child care programs, though there are
exemptions for
religious, medical or other reasons. Under Biden’s plan, all companies with more than 100 workers will
have to either require their employees be immunized or undergo weekly
testing. Biden also acted to mandate shots for federal
contractors and most federal workers, and expanded a previously announced
vaccine mandate for nursing-home workers to cover virtually all
health care workers. Some states already mandate certain vaccinations for specific
categories of adults. New
York, for example, requires that all workers in hospitals, nursing homes
and other health care facilities be immunized against measles and rubella.
Rhode Island requires child care workers to
not only be immunized against several common childhood diseases, but to get
an annual flu shot, too. Several states have specific vaccination mandates
for college students. But in the main, most vaccine mandates apply to children and teens.
We studied state laws, regulations and information from state health
departments to assess how widely mandated the CDC’s vaccine recommendations
are. Of the 16 immunizations the CDC recommends for children and teens,
all 50 states (plus the District of Columbia) mandate diphtheria, tetanus,
pertussis (whooping cough), polio, measles, rubella and chickenpox. In
addition, every state except Iowa mandates immunization against mumps. (The
diphtheria, tetanus and pertussis vaccines usually are given as a single
combined shot, as are the measles, mumps and rubella vaccines.) Except for
the chickenpox vaccine, which became available in the United States in 1995,
all those vaccines have been around for 50 years or more. Among newer childhood vaccines, though, state mandates are something
of a mixed bag. Only two states (Alabama and South Dakota) don’t require
vaccination against hepatitis B at some point in a child’s life, but about
half (24) don’t require it for hepatitis A. Just six states – five of them in
the Northeast – require annual flu vaccines for child care or preschool
enrollment, and none do so for K-12 students. Three vaccines – against rotavirus, pneumococcal disease and Haemophilus influenzae type b, or
Hib – typically are recommended for children younger than 5 years old. (Hib,
despite what its name might imply, doesn’t cause the flu, but it can cause
a range of other
ailments, from mild ear infections to potentially deadly meningitis and
blood infections.) However, while all but four states mandate the Hib vaccine
for day care or pre-K, 10 don’t require the pneumococcal shot, and only eight
require immunization against rotavirus. The remaining two vaccines, against human papillomavirus (HPV)
and meningococcal
disease, are recommended for teens and older children around age 11 or
12. A majority of states (33, as well as D.C.) require the meningococcal
vaccine, although Massachusetts is phasing in its requirement and Vermont
only requires it for students living on campus. But only D.C., Hawaii, Rhode
Island and Virginia require the HPV
shot, which protects against cervical and other cancers but has
been controversial because HPV is transmitted sexually. Vaccination mandates in the U.S. date back to the 19th century, when
many cities and states started requiring children to be immunized against
smallpox; the Supreme Court upheld such mandates in a landmark
1905 decision. A combination vaccine against diphtheria, tetanus and
pertussis became available in 1948, and it was quickly added as a routinely
recommended shot. In 1977, the World Health Organization’s Expanded Program on
Immunization set a
goal of giving every child in the world access to immunization
against six diseases by 1990: dipththeria, pertussis, tetanus, polio, measles
and tuberculosis, or TB. (Infants and small children are commonly vaccinated against TB in
countries where the disease is prevalent. In the U.S., however, only children
who are specifically at risk for contracting TB – or adults in high-exposure
settings, such as health care workers – are offered the shot.) (PEW) OCTOBER 8, 2021 711-712-43-28/Polls The 2020 Census Counted 126.8 Million Occupied Households,
Representing 9% Growth Over The 116.7 Million Households Counted In The 2010
Census
Growth in the number of U.S. households during the 2010s slowed to
its lowest pace in history, according to a Pew Research Center analysis of
newly released 2020 census data. The 2020 census counted 126.8 million occupied households,
representing 9% growth over the 116.7 million households counted in the 2010
census. That single-digit growth was more anemic than the prior record low
percentage growth of households (11%) during the previous decade, as shown in
the 2010 census. The decennial census has counted the number of U.S.
households on a consistent basis dating back to 1850. From 2010 to 2020, the number of households increased by 10.1 million
– fewer than in any decade from 1950 to 2010. For example, in the 1970s, when
the adult population was much smaller, the U.S. added 16.9 million
households. The subpar growth in households over the last decade matters because
household formation has implications for the broader economy. It can impact
the demand for housing and stimulate both single family and multifamily
construction. Associated with that is spending for durable goods such as
furniture and appliances. The slowdown in economic growth over the 2010s is
partly a reflection of weak household formation and low levels of home building. Several long-term demographic trends are affecting U.S. household
growth. A fundamental driver of household growth is population
growth. The population residing in households (that is, those who do not
live in group quarters such as dorms, prisons or nursing homes) grew by only
7.5% in the last decade, the slowest population growth since the 1930s. Beyond population growth, another demographic trend also slows growth
in the number of households: Multigenerational family living has been
increasing. In 2016, 20% of the U.S. population lived in multigenerational
family households, up from 12% in 1980. Almost all of these involve two
or more adult generations living under one roof rather than in separate
households. More broadly, the U.S. racial or ethnic groups that are growing most
rapidly are less likely than other groups to live in their own households, in
part because adults in these groups are younger. Asian and Hispanic adults
– the
fastest growing racial or ethnic groups in the U.S. – are less
likely than White and Black adults to live in separate households. In 2020,
there were 42.2 households for every 100 Hispanic adults and 41.9 households
for every 100 Asian adults. White (53.3 households per 100 adults) and Black
adults (55.0 households per 100 adults) were more likely to live in separate
households. Another factor affecting household growth is the declining tendency
of adults to live
alone. Throughout much of the 20th century, American adults had been
increasingly living alone. That trend has slowed markedly since the early
2000s. Adults ages 65 and older are the most likely to live alone. The share
of older adults living alone peaked in the mid-1990s (32%) and has since
retreated (27% as of 2020). The rate at which adults are living in their own household declined over
the past decade among younger and older adults alike, with the exception of
those ages 55 to 64. Still, older adults remain more likely than those who
are younger to live in their own households, in part because incomes rise as
people get older and they have more economic resources to set up their own
household. In 2020, there were 34.7 households per 100 adults ages 18 to 34,
compared with 63.2 households per 100 adults ages 65 and older. Overall, the
household formation rate declined slightly from 51.5 households per 100
adults in 2010 to 50.9 households per 100 adults in 2020. Some geographic trends may also be contributing to diminished
household growth. The U.S. population is increasingly likely to live in
metropolitan areas. Today, 14% of the adult population is in rural areas,
down from 16% in 2010. Adults in rural areas are more likely to live in their
own households (54.9 households per 100 adults) than adults in metropolitan
areas (50.2 households per 100 adults). Rising housing costs are
also likely undermining household growth. Nationally, rents have
been rising much faster than inflation in general. From 2010 to
2020, the consumer price index for rent of primary residence rose 37%,
compared with an increase of 13% for the CPI for all items except for
shelter. Home prices have roughly doubled since 2000, according to the Case-Schiller national
home price index. Census experts had previously noted the slow household growth over
the decade and surmised that household growth might
lag population growth over the decade, resulting in the first ever
increase in household size. That did not come to pass, as the average
household size decreased from 2.58 (2010) to 2.55 (2020). Slow household growth has played out differently across the states
and the District of Columbia. Fifteen states and the District of Columbia had
double-digit growth since 2010, with Utah leading the nation (20%).
Conversely, 18 states had household growth of 5% or less, with West Virginia
as the only state to experience a decline in the number of households (-3%).
The growth (or decline) in households across states largely reflects
population changes during the decade. (PEW) OCTOBER 12, 2021 711-712-43-29/Polls Nine-In-Ten U S Adults Say There Are Conflicts Between People Who
Support Different Political Parties
The United States stands out among 17 advanced economies as one of
the most conflicted when it comes to questions of social unity. A large
majority of Americans say there are strong political and strong racial and
ethnic conflicts in the U.S. and that most people disagree on basic facts.
And while Americans are not alone in this regard – France and South Korea
also stand out as strongly conflicted societies – findings from a
new Pew Research Center report reveal exactly how the U.S. is more
divided than other societies surveyed. Nine-in-ten U.S. adults say there are conflicts between people who
support different political parties, while an overall median of 50% say the
same across all advanced economies surveyed. Similarly, about seven-in-ten
Americans say there are conflicts between people with different ethnic or
racial backgrounds in the U.S., more than all the other publics surveyed. As
a comparison, only about a quarter in Singapore and Taiwan and a third in
Spain say the same. On religious and urban-rural conflicts, the U.S. has the
third-highest share saying there are conflicts in each case. The only places
where a larger share holds these views are France and South Korea. Nearly three-quarters of Americans (74%) say that racial and ethnic
discrimination is a serious problem in the U.S., compared with a 17-public
median of 67% who say racial and ethnic discrimination is a serious problem
in their societies. There is wide variation on the item, however, with just
17% in Taiwan saying racial and ethnic discrimination is a serious problem
and 82% in France and Italy saying the same. And the U.S. ranks near the top when it comes to whether people agree
on basic facts: A majority of Americans (59%) say people can’t agree on basic
facts, second only to France (61%). In the U.S., there are large political divisions on most of the
measures of societal conflict. Democrats and Democratic-leaning independents
are significantly more likely than Republicans and Republican-leaning
independents to say there are conflicts on each of the items surveyed, with
one exception: An equal share (90%) of partisans on both sides say there are
strong or very strong conflicts between people who support different
political parties. Previous findings in the U.S. showed that about equally
large shares of Americans said conflicts between Democrats and
Republicans were strong or very strong. Democrats are also significantly more
likely than Republicans to say racial and ethnic discrimination is a serious
problem in the U.S., in line with long-standing findings that show wide
partisan divisions on racial and ethnic inequality. There are also significant differences on questions of societal
conflict when it comes to racial and ethnic identity in the U.S. White
non-Hispanic adults are significantly more likely than Black non-Hispanic or
Hispanic adults to say there are conflicts between people who support
different political parties, though large majorities of all three groups hold
this opinion. When it comes to conflict between people with different racial
and ethnic backgrounds, 82% of Black Americans say there are very strong or
strong conflicts, compared with around seven-in-ten White and Hispanic
Americans. Black and Hispanic adults are significantly more likely than White
adults to say there are conflicts between people who practice different
religions. Partisans in the U.S. are roughly equally likely to say that
Americans disagree about basic facts. Six-in-ten Democrats share this view,
as do about six-in-ten Republicans. But liberal Democrats (68%) are
significantly more likely than moderate and conservative Democrats (52%) to
say most Americans disagree on basic facts. Among conservative Republicans,
62% say most people disagree on basic facts, while 54% of moderate and
liberal Republicans say so. About six-in-ten White non-Hispanic and Hispanic adults say when it
comes to important issues facing the U.S., most people disagree on basic
facts. Black non-Hispanic adults are significantly less likely to hold this
view than White or Hispanic adults, with 49% saying most people disagree on
basic facts. Those with a college degree or more education are also
significantly more likely to say people disagree on basic facts than those
with some college or less (63% and 56%, respectively). (PEW) OCTOBER 13, 2021 711-712-43-30/Polls Nine In 10 Remote Workers Want To Maintain Remote Work To Some Degree
WASHINGTON, D.C. -- Forty-five percent of full-time U.S. employees
worked from home either all (25%) or part of the time (20%) in Gallup's
September update of its monthly employment trends. These figures are
unchanged from remote working rates in July and August, signaling that U.S.
companies' return-to-office plans remain on hold.
Line graph. Monthly trend from April 2020 to September 2021 in amount
U.S. employees are working remotely/from home. Most recently, 25% worked
exclusively from home, and 20% worked some of the time from home, for a total
of 45% working remotely. These rates have been steady each month since July.
The overall percentage working remotely was highest last April, at 69%,
before trending down to just over half by October 2020. Given the high proportion of white-collar jobs traditionally done in
an office, the remote rate among these workers is particularly noteworthy.
Two-thirds of employees in white-collar jobs (67%) reported working from home
either exclusively (41%) or some of the time (26%) in September, As with the rate of remote work among all full-time employees, remote
working among white-collar workers has been steady in recent months. However,
the percentage has dwindled since January's 79% as the vaccination rate among
Americans has increased, giving more people the confidence and freedom to
return to the office.
Line graph. Monthly trend from April 2020 to September 2021 in amount
white-collar workers in the U.S. have been working remotely, from home. Most
recently, 41% were working exclusively from home and 26% partially from home,
for a total of 67% working from home to some degree. The overall percentage
working remotely was highest last April, at 83%. It varied for several months
before steading near 75% in January. It fell to 68% in March and has since
held near that level. In contrast to the high rate of remote work in white-collar
professions, working remotely is far less prevalent among workers with
interactions that typically occur in person, such as in education (48%) and
healthcare (35%). Gallup's trends on remote work are based on Gallup's COVID-19 survey
conducted via web surveys using the nationally representative,
probability-based Gallup Panel. The latest results are based on adults
employed full time who work for an employer (are not exclusively
self-employed) interviewed in mid-September. Employees See Many Advantages to Remote
Work Separately, Gallup's State of the Workforce study conducted in
May/June with more than 9,000 American workers finds strong reasons for
employers to consider bringing remote workers back to the office in a hybrid
fashion -- spending part of the week at home and part on-site. Most notably, the study reveals that:
DETAILED FINDINGS Workers Overwhelmingly Desire the
Flexibility of Some Remote Work When asked what their preferred work location would be going forward,
91% of remote workers interviewed in May/June (those fully and partially
remote, combined) indicated they wanted to be hybrid (54%) or exclusively
remote (37%). But the amount employees wanted to work remotely differed
according to their work situation:
U.S. Employees' Preferred Future Work Arrangement, by Current Work
Arrangement
In summary, most employees working hybrid want to continue working
hybrid (70%). About half of exclusively remote workers (49%) and 37% of those
on-site in a job that could be done remotely would prefer hybrid. Commute Time, Wellbeing and Flexibility Are
Top Reasons to Work Remotely When asked to name the top three reasons for their work location
preference, those who say hybrid or exclusively remote work is ideal are most
likely to cite the lack of commute time. Improvements to their wellbeing and
the flexibility it affords are the next two highest-ranked reasons. At the same time, those who prefer exclusively remote work uniquely
mention "having fewer distractions" as a top perk. This speaks to
the advantage of having more focused work time when working entirely from
home. Conversely, those who prefer hybrid work uniquely mention getting to
"spend time in person with coworkers," which speaks to the
opportunities for interpersonal connection and collaboration afforded by this
type of flexible work arrangement. Meanwhile, employees who would prefer to be fully on-site chiefly
name productivity as the top reason for that choice, followed by better
access to technology and easier collaboration with others. Personal productivity and wellbeing make it into the top five reasons
across all three location preferences, underscoring that workers'
productivity and wellbeing needs are met differently. Where people work best
is highly individualized and dependent on the type of work they do -- and how
much collaboration time they require.
Table showing U.S. employees top reasons for why they prefer to work
either fully on-site, fully remote, or hybrid (partially on-site and
partially remote). Those who prefer to be on-site are most likely to say it
makes them feel more productive (41%), followed by having better access to
technology (32%), finding it easier to collaborate (32%), feeling more
connected to their organization (31%), and saying it's better for their
wellbeing (30%). The top three reasons for those preferring to be fully
remote are avoiding commute time (52%), saying it's better for their
wellbeing (44%) and needing flexibility to balance family and other obligations
(37%). The top three reasons for those preferring to be hybrid are the same,
with 48% naming each. Additionally, 35% of those preferring to be fully
remote say they feel more productive and 29% cite having fewer distractions.
Among those who prefer hybrid, 30% cite having the option to work in-person
with coworkers and 26% say they feel more productive. Hybrid Workers Disagree on How to
Coordinate Office Time Managing hybrid workers, many of whom grew accustomed to working
exclusively from home over the past year, may take some finesse. There is
little agreement among employees regarding how often and when they want to go
to the office. When asked how often they want to work on-site in a hybrid setting,
38% said they preferred to spend 2-3 days in the office. In contrast, 37%
want to spend less than 2-3 days on-site, and 24% would like to be in the
office more often than 2-3 days per week. When asked how they want their time in the office to be determined,
nearly four in 10 employees (38%) who want a hybrid arrangement going forward
desire complete flexibility and autonomy in those decisions. This group wants
the decision about how many days, and which days, to be on-site each week
left entirely up to them. In contrast, the remaining six in 10 would rather have their
employer, manager or team establish clear guidelines for being in the office:
Mixed Predictions For Impact of Remote Work
on Work Culture The majority of full-time U.S. employees are unconcerned about the
effect that remote work could have on their company's culture. Among all
workers, 54% believe the culture of their company would be the same if a
substantial number of employers worked remotely long-term, and 12% think it
would be better, while 33% predict it would be worse. Employee views on the culture question differ according to workers'
current remote work status -- the more employees work from home, the more
upbeat they are about the potential effect of remote work on company culture.
By contrast, exclusively on-site workers are divided, with 49% believing that
having people work remotely long-term would make the culture worse, while 7%
say it would be better and 44% say it would be about the same. Will Calling Workers Back Drive Them Away? About three in 10 remote workers (31%) say that losing the option of
working from home, should their employer remove it, would make them extremely likely to look for
employment with another organization. That stretches to 49% when factoring in
those rating their chance of leaving a "4" on the five-point
likelihood scale. The inclination to leave over losing the ability to work remotely is
higher among employees working exclusively from home (37% describe themselves
as "extremely" likely to look for another job) than among those
working partially from home (19%). U.S. Employees' Likelihood of Leaving Job Over Lack of Remote Work
Option, Based on Current Work Arrangement If your employer decides not to offer opportunities for you to work
remote some or all of the time long term, how likely would you be to look for
opportunities for employment with other organizations?
Remote Workers See Hybrid in Their Future Three in four employees who were working remotely exclusively or part
of the time in September indicate that their employer will allow people to
continue working from home on some basis. For now, an even higher percentage of remote workers expect to be
working from home for "the rest of the year and beyond." About a
quarter (27%) plan to do so exclusively, and another six in 10 (61%) plan to
do so part of the time. Just 9% anticipate working a minimal amount from home
or not at all. Amount Remote U.S. Employees Anticipate Working Remotely for Rest of
the Year and Beyond
Looking at the U.S. workforce at large, regardless of where people
are currently working, the poll finds that 13% of all full-time employees
plan to work exclusively from home, 31% plan to work hybrid and 52% plan to
work fully on-site, with 4% unsure. Bottom Line Pre-pandemic normalcy remains elusive, but a new normal has settled
in among workers who have grown accustomed to working from home -- commuting
less and enjoying improved wellbeing and flexibility. Nearly half of
full-time employees in the U.S. (45%), including two-thirds of white-collar
employees (67%), are still working from home to some degree. The good news
for these workers -- who overwhelmingly do not want to return to the office
full time -- is that their employers largely foresee making remote work a
permanent offering, at least on a hybrid basis. Leaders and managers may
recognize the many benefits of remote work, along with the risk of losing top
talent if remote work flexibility is taken away. Employers may still worry about the effect remote work has on company
culture, but most workers do not share this concern. The greater risk to
culture could be not providing
options for work location flexibility that match what employees desire and
make them more productive. Gallup research suggests that a mismatch between where
employees work best and where they are required to work could impair employee
engagement, and ultimately, employee retention. (Gallup) OCTOBER 13, 2021 Source: https://news.gallup.com/poll/355907/remote-work-persisting-trending-permanent.aspx 711-712-43-31/Polls 67% Of Americans Perceive A Rise In Extreme Weather, But Partisans
Differ Over Government Efforts To Address It
Two-thirds of Americans say extreme weather events across the country
have been occurring more often than in the past. Far fewer say they’re
happening about as often (28%), and only 4% say they are happening less
often, according to a new Pew Research Center survey. The findings come amid
reports that climate change has contributed to an increase
in weather-related disasters. When it comes to firsthand experiences with extreme weather, 46% of
U.S. adults say the area where they live has had an extreme weather event
over the past 12 months, according to the survey, which was conducted Sept.
13 to 19 among 10,371 adults. Global leaders are set to meet this
fall at COP26, a United Nations conference on climate change, where
attendees will discuss progress on cutting greenhouse gas emissions to limit
global warming. Climate activists have argued that urgent
action is needed as the world faces more frequent extreme weather
events. Nearly three-quarters of U.S. adults (73%) in the West South
Central census
division – an area hit hard by Tropical Storm Nicholas and Hurricane
Ida – say they’ve experienced extreme weather within the past year. A
majority of adults (59%) say the same in the Mid-Atlantic region, which was
affected by recent heavy rains associated with Ida. By contrast, far fewer
say they’ve experienced extreme weather in other regions over the past year,
including in the South Atlantic (34%) and East North Central census divisions
(31%). In most census regional divisions, however, Democrats and
Democratic-leaning independents are more likely than Republicans and
Republican leaners to report experiencing extreme weather within the past
year. Overall, about half of Democrats (51%) say the area where they live
has experienced extreme weather in the past year, compared with a smaller
share of Republicans (39%). A large majority of Democrats and Democratic-leaning independents
(85%) say extreme weather events across the country have been occurring more
often than in the past. Far fewer Republicans and GOP-leaning independents
(44%) say the same; 52% of Republicans instead say such events are happening
about as often as in the past. When asked to think about the government’s role when it comes to
building in areas at high risk from major storms, floods and wildfires, 62%
of U.S. adults say they are more concerned that government will not go far
enough in limiting new construction. A smaller share (33%) say they are more
concerned government will go too far in limiting new construction in
high-risk areas. A large majority of Democrats (79%) say their greater concern is that
government will not go far enough in limiting construction in areas at high
risk for extreme weather. Views among Republicans tilt in the opposite direction: 53% say they
are more concerned that government will go too far in limiting new
construction in high-risk areas, while 43% say their greater concern is that
government will not go far enough. Those who say they have experienced extreme weather in their
community recently are slightly more likely than those who have not to say
their greater concern is that government will not go far enough to limit new
construction in high-risk areas, though majorities in both groups take this
view (66% and 59%, respectively). How the public views key infrastructure
goals The survey also asked Americans about different aspects of the
country’s infrastructure that the federal government could address. At the
top of the list is making structural improvements to roads and bridges:
Roughly six-in-ten adults (62%) say this is very important to them
personally. About half (51%) say it is very important for the federal government
to build systems to make wastewater reusable in dry regions. Climate
scientists expect that climate change will increase
the severity of droughts in the future. The survey also asked about the idea of stricter building standards
to better withstand major storms, floods and wildfires – a strategy that
could help reduce damaging effects from climate change. Around half of adults
(48%) say setting stricter building standards is a very important goal to
them, and 37% view this as a somewhat important goal. Around four-in-ten or more Americans say it is very important to them
for the federal government to provide broadband internet access to
communities that don’t have it (45%) and to expand public transportation
systems (39%). Only 24% of adults say it is very important for the federal
government to build more charging stations to increase the use of electric
vehicles receives – the lowest level of public importance for any of the six
items in the survey. Around four-in-ten adults (41%) say this is not
important, while about a third (34%) say it is somewhat important to them. In
an earlier
Center survey, just 7% of U.S. adults said they currently own an electric
or hybrid vehicle. Overall, 51% of the public favors
the infrastructure bill now being debated in Congress, compared with
a smaller share (20%) who oppose it; 29% say they aren’t sure how they feel
about it. Partisanship matters far more than other factors – including where
people live – when it comes to Americans’ views about the country’s
infrastructure and the government’s role in adaptation to risks from extreme
weather. For instance, 62% of Democrats say it’s a very important goal for the
federal government to set stricter standards to better withstand major
storms, floods and wildfires. Half as many Republicans (31%) say that is very
important to them personally. There are generally modest differences in views between those who say
they have experienced extreme weather locally in the past year and those who
say they have not. (PEW) OCTOBER 14, 2021 711-712-43-32/Polls Half Of U S Congregants (54%) And Nearly Three-Quarters Of
Evangelical Churchgoers (73%) Say Their Clergy Have Not Said Much About
Covid-19 Vaccinations Either Way
As houses of worship continue to reopen, most U.S. adults who
regularly attend religious services voice confidence in their clergy to
provide guidance on the coronavirus vaccines – and far more say they have
heard their pastor, priest, rabbi or imam encourage people to get vaccinated
than have heard their clergy raise doubts about COVID-19 vaccines. But a slim
majority of regular worshippers say they have not heard their religious
leaders say much about vaccinations either way, according to a new Pew
Research Center survey conducted Sept. 20-26, 2021.
The survey finds that a growing share of Americans are now attending
religious services in person. Among those who say they typically attend
services at least once or twice a month, a clear majority (64%) report that
they actually have gone in person in
the past month, the first time that has been the case in three surveys
conducted since the pandemic began. The resumption of in-person attendance has been accompanied by a
decline in the share of both U.S. adults overall and regular worshippers who
say they have watched religious services online or on TV in the past month. Many U.S. congregants – i.e., people who say either that they
typically attend religious services at least monthly or that they have attended in
person in the past month, who together comprise a little more than a third of
all U.S. adults – say they have heard the clergy or religious leaders at
their house of worship weigh in on coronavirus vaccines. And among those who
have heard from their clergy on this issue, far more say their priest,
pastor, rabbi, imam or other religious leader has encouraged people to get
vaccinated (39% of all religious attenders) than say their clergy has
discouraged getting the shots (5%). Even among evangelical Protestants, who have tended to be relatively
skeptical toward the vaccines, just 4% say their clergy have discouraged
people from getting a vaccine. But more than half of U.S. congregants (54%)
and nearly three-quarters of evangelical churchgoers (73%) say their clergy
have not said much about COVID-19 vaccinations either way. Most members of
the historically Black Protestant tradition, on the other hand, say their
pastors have encouraged people to get a vaccine (64%).
Religious attenders express more trust in their clergy on this issue
than they do in state elected officials, local elected officials or news
media. Among the options presented by the survey, only primary care doctors
rank above clergy in the share of U.S. congregants who have at least “a fair
amount” of trust in each group to provide guidance on vaccines. Clergy have responded in differing ways to the COVID-19 outbreak that
began in the United States in early 2020. At various points in the pandemic,
some religious leaders have refused
to limit attendance or enforce other public health restrictions at
their houses of worship. At the same time, other members of the clergy have
encouraged vaccinations and even hosted
vaccination sites at their churches or other facilities. Americans overall express ambivalent views about the broad impact of
churches and other religious organizations on the U.S. response to the
pandemic, with 25% saying that religious organizations have done “more harm
than good” and 22% saying they have done “more good than harm.” About half
(52%) say that religious organizations have not made much difference. There is a substantial gap between the two major political parties on
this question, with four-in-ten Democrats and those who lean toward the
Democratic Party saying that religious organizations have done more harm than
good (39%), compared with just one-in-ten Republicans and GOP leaners who
take that position (9%). Even more broadly, there appears to have been a modest but noticeable
change in recent years in the way Americans view the role of churches and
other houses of worship when it comes to addressing social and political
issues. Some pastors
have waded into a wide range of political and social debates
regarding not only the pandemic but also the 2020 presidential election and
the national conversation on racial injustice in the wake of the murder of
George Floyd.
There has been little change on two other questions about religion’s
role in public life over the past few years: More people continue to say that
churches and other religious organizations mostly bring people together
(rather than push them apart), and that in general – not just regarding the
pandemic – religious institutions do more good than harm (as opposed to more
harm than good). These are among the key findings from a new Pew Research Center
survey of 6,485 U.S. adults, conducted on the Center’s American
Trends Panel. Although the survey was conducted among Americans of all
religious backgrounds, including Jews, Muslims, Buddhists, Hindus, Mormons
and more, it did not obtain enough respondents from these smaller religious
groups to report separately on their views. The remainder of this report explores the survey findings in more
detail. Roughly equal shares of U.S. adults
recently have attended religious services in person and virtually
A similar share of Americans in the new survey (28%) say they have
watched religious services online or on TV in the past month, down modestly
from March 2021 (33%) and July 2020 (36%). This drop has been particularly
pronounced among U.S. adults who say that they typically attend religious
services at least monthly. Within this group, the share who have watched
virtual services (online or on television) has dropped from 72% to 65% to 55%
over the course of the three surveys, and virtual participation is now
especially low among Catholic churchgoers (35%). Meanwhile, Americans who typically attend religious services are now
attending in person at a much higher rate. Only a third reported doing this
during the summer of 2020, but that share has nearly doubled in the new
survey (64%). Evangelical Protestant churchgoers (72%) are more inclined than
those in the mainline Protestant (56%) or historically Black Protestant (50%)
traditions to have attended recently in person. Most congregants say houses of worship are
open with coronavirus-related restrictions in place, and that this should be
the case The rise in religious service attendance is accompanied by an
increase in the number of churches and other places of worship that are
reopening to in-person services and/or loosening pandemic-related
restrictions. Among U.S. adults who say they typically attend religious
services at least monthly or who attended in person in the past month, a
growing share report that the house of worship they attend most often is now
open for in-person services. This includes three-in-ten (29%) who say their
congregation is open to the public and holding services just as it did before
the pandemic – up from 12% who said this about their congregation in March
2021. Most U.S. religious attenders (59%) continue to say that their house
of worship is open for services, but with precautions in place to protect
against COVID-19. Just 6% now say their congregation is closed entirely for
in-person services, down from 31% who said this in July 2020 and 17% earlier
this year. Congregants who identify with the evangelical Protestant tradition
are far more likely than other Christians to say that their churches are open
without any coronavirus-related restrictions. Roughly half of evangelical
Protestants (49%) say this is the case, compared with 20% of mainline
Protestants, 14% of congregants in the historically Black Protestant
tradition and 19% of Catholics. White religious attenders are more likely than Black and Hispanic
congregants to say their houses of worship are back to normal operations (38%
vs. 16% and 20%, respectively). Republicans and those who lean toward the
Republican Party also are much more likely than Democrats and Democratic
leaners to report that their congregations are open without restrictions (43%
vs. 16%). Still, no more than about one-in-ten in any of these groups say
that their house of worship remains closed entirely to in-person services. When asked what should be
happening in their religious congregations – as opposed to what
actually is happening
– survey respondents give similar answers. For example, the percentage of
religious attenders who say their congregation is open to the public for
services with some health restrictions in place as a result of the
coronavirus (59%) is identical to the share who say this should be the case (59%). Among religious attenders, evangelical Protestants, White
(non-Hispanic) Americans and Republicans are considerably more inclined than
others to say their congregations should be open without pandemic-related
restrictions. For instance, half of evangelical Protestant churchgoers take
this position, compared with a quarter of Catholic churchgoers. And 53% of
Republicans and people who lean toward the Republican Party say their
congregations should be open without restrictions, compared with 15% of
Democrats and people who lean toward the Democratic Party. Most worshippers feel at least ‘somewhat’
confident in safety of communal worship, but fewer than half are ‘very’
confident The vast majority of U.S. adults who typically attend religious
services or have gone in person in the past month (82%) now say they feel at
least somewhat confident they could safely worship in person without catching
or spreading the coronavirus. This figure is up slightly since March 2021
(76%), although the share who say they are very confident they can attend religious services
safely is unchanged over this period, at 45%. And among those who actually
have attended in person in the past month, the share who say they are very
confident they can do so safely has fallen from 66% in March to 54% in
September. More than half of White (non-Hispanic) religious attenders (55%) now
say they are very confident they can attend religious services in person
without catching or spreading COVID-19, far higher than the share of Black
(35%) or Hispanic (23%) worshippers who say the same, mirroring a pattern
from the earlier surveys. There also is a persistent partisan gap: Republican
congregants are twice as likely as those who identify with or lean toward the
Democratic Party to say they are very confident in the safety of communal
worship (62% vs. 30%). Most U.S. congregants express at least some
trust in their clergy’s guidance on COVID-19 vaccines Where do religious leaders stand in comparison with other authorities
as trusted sources of information about coronavirus vaccinations –
particularly as many Americans express
skepticism about the vaccines? In the opinion of U.S. adults who typically attend religious services
at least monthly or who attended in person in the last month, primary care
doctors are by far the most trusted source of information asked about in this
survey. Fully 84% of monthly attenders say they have either “a great deal” or
“a fair amount” of confidence in their own doctor to provide guidance about
receiving a COVID-19 vaccine. But those who regularly attend religious services also express trust
in their clergy or other religious leaders at their house of worship as
sources of information about coronavirus vaccinations. About six-in-ten
monthly attenders (61%) say that they have at least a fair amount of
confidence in their religious leaders to provide reliable guidance about the
vaccines, nearly identical to the share who express confidence in public
health officials such as those at the CDC. Overall, more Americans who attend
religious services at least monthly express trust in their clergy and
religious leaders to provide vaccine guidance than say the same about their
state elected officials, their local elected officials or the news media. Black Americans who attend religious services are especially likely
to be confident in their clergy to provide guidance about receiving the
COVID-19 vaccine, with 77% expressing at least a fair amount of confidence in
religious leaders to do so, compared with 59% of White (non-Hispanic) and 62%
of Hispanic congregants.
Catholic Americans are split on this question: 47% say they have “a
great deal” or “a fair amount” of confidence in Francis to provide vaccine
guidance, while 52% say they have “not too much” confidence or “no confidence
at all” in the pope as a source of information on coronavirus vaccinations.
Six-in-ten Catholics who attend Mass monthly or more often say that they have
at least a fair amount of confidence in Pope Francis to provide guidance
about the shots – similar to the share who say the same about their own
parish priests (56%). Meanwhile, 40% of Catholics who attend Mass less often
have the same level of confidence in the pope. More than half of U.S. congregants have not
heard advice from clergy about coronavirus vaccines
Nearly six-in-ten Democrats and Democratic leaners who attend
religious services say that their religious leaders have encouraged people to
get vaccinated, compared with just 24% of Republican attenders who say they
have heard the same message from their religious leaders. Additionally, almost two-thirds of Protestants in the historically
Black tradition (64%) say their clergy have encouraged people to get the
vaccine, much higher than the share of Catholics (42%), mainline Protestants
(42%) and evangelical Protestants (21%) who say they have received the same
kind of encouragement from their leaders. Still, just 4% of evangelicals say
they have heard their clergy discourage the
vaccine. Most Americans say churches and other
religious organizations should keep out of politics
There are differences in views of this question based on race, party
affiliation and religious affiliation. Black adults are more likely than
White, Asian or Hispanic adults to say that churches and other houses of
worship should express
their views on political and social matters, with 40% saying this is
something they support. Additionally, 37% of U.S. adults who identify with or
lean toward the Republican Party say that churches should express their views
on these matters, while fewer Democrats and Democratic leaners (24%) say the
same. Even though a strong majority of evangelical Protestants identify
with the GOP and a larger majority of Protestants in the historically Black
tradition identify with the Democratic Party, the two groups have similar
views on this question, with relatively large shares saying that churches
should express their views on political and social issues (47% and 45%,
respectively). Smaller shares of mainline Protestants and Catholics say the
same, with roughly three-quarters in each group saying that churches and
other houses of worship should refrain from weighing in on political matters. On balance, religious organizations still
viewed as positive forces in society
More U.S. adults say churches and religious organizations mostly
bring people together rather than push people apart (52% vs. 19%), and 28%
say they do neither. These figures are little changed since 2019 and 2017. Christians are far more likely than religiously unaffiliated
Americans to say that religious organizations mostly bring people together
(66% vs. 25%), with evangelical Protestants especially likely to hold this
view (77%). Meanwhile, most self-described atheists (62%) say religious
groups mostly push people apart. Additionally, Republicans and independents
who lean Republican are much more likely than Democrats to say churches and
other religious institutions mostly bring people together (70% vs. 40%).
Once again, Christians are much more positive than the religiously
unaffiliated in their assessments of the influence of religious organizations
on public life, as are Republicans compared with Democrats. Two-thirds of
Christians (67%) say that all things considered, churches do more good than
harm in American society, a view shared by just 26% of religious “nones.” And
roughly seven-in-ten Republicans (71%) express this positive view of
religious organizations, compared with four-in-ten Democrats. Notably, U.S. adults between the ages of 18 and 49 are about twice as
likely as those ages 50 and older to take the opposite position, saying that
churches and religious organizations do more harm than good (27% vs. 14%). No clear consensus on religious
organizations’ impact amid pandemic
Most Christians (55%) say that churches have not made much of a
difference in the country’s handling of the coronavirus, with the remainder
more likely to say they have helped (28%) rather than harmed (16%). A strong
majority of atheists (71%), meanwhile, say that religious organizations have
done more harm than good in the country’s response to the pandemic. Democrats are much more likely than Republicans to say that churches
have done more harm than good in the country’s response to the pandemic (39%
vs. 9%), as are Americans who attend religious services a few times a year or
less compared with those who attend monthly or more often (30% vs. 14%). (PEW) OCTOBER 15, 2021 711-712-43-33/Polls Roughly Eight-In-Ten Members (82%) Of The Historically Black
Protestant Tradition Who Attend Church Once A Month Or More Have Received At
Least One Dose Of A Covid-19 Vaccine
Religious institutions have helped shape many Americans’ experience
of the COVID-19 pandemic, from providing virtual
spaces for community and worship to offering a range
of opinions about the importance of wearing masks and getting
vaccinated. Black churches in particular, which often
play prominent roles in Black civic life, have received a lot of
attention for holding
vaccination clinics and urging
members to get a coronavirus shot. And according to a new Pew
Research Center analysis, members of the historically Black Protestant
tradition who regularly attend church are more likely to be vaccinated than
those who do not attend regularly. Roughly eight-in-ten members (82%) of the historically Black
Protestant tradition who attend church once a month or more have received at
least one dose of a COVID-19 vaccine, compared with 60% of those from the
same religious tradition who attend church less often, according to the
analysis, based on a survey
conducted Aug. 23-29, 2021. A later poll, fielded Sept. 20-26, sheds some
light on possible explanations for this large gap: Nearly two-thirds of
regular churchgoers in the historically Black Protestant tradition (64%) say
that their pastors have encouraged people to get a COVID-19 vaccine. For Americans overall, church attendance is not associated with a
significantly higher or lower chance of having received a
COVID-19 vaccine, with similar shares of U.S. adults who
routinely attend religious services (72%) and those who do not attend
regularly (74%) saying they received at least one shot. Moreover,
among U.S. adults who regularly attend religious services, 39%
have been encouraged by clergy at their houses of worship to get the vaccine,
while most (54%) say their clergy have not said much about the vaccines
either way. There are other factors involved, aside from the different roles that
churches and clergy play in different communities. In some Christian
traditions, such as among Catholics and evangelical Protestants, regular
attenders are more likely than those who attend less often to align with the
Republican Party – and Republicans
are less likely than Democrats to be vaccinated. But in historically
Black churches, members are overwhelmingly Democrats or Democratic leaners,
whether or not they regularly attend church. Members of the historically Black Protestant tradition who regularly
attend church are also older, on average, than those who do not, and older
Americans in general are more likely to be vaccinated. But age alone does not
explain the wide gap in vaccination between churchgoers and others in the
historically Black Protestant tradition. Since their earliest
days in the 19th century, Black churches have been active in Black civic
life beyond being places of worship. To counter lack of access to public
services and economic opportunity, Black churches have often run job training
programs, insurance cooperatives, circulating libraries and athletic clubs. Earlier in the COVID-19 pandemic,
Black Americans were less likely than White Americans to have received at
least one dose of a vaccine and were more likely to express hesitancy to do
so. The vaccination gap has
closed, perhaps in part due
to partnerships between Black
church leaders and vaccine
providers. In fact, people who regularly attend Black Protestant churches have
unusually high levels of confidence in their pastors and other religious
leaders to provide guidance on the COVID-19 vaccines. About eight-in-ten
churchgoing members of the historically Black Protestant tradition (78%) say
they have either a great deal of confidence or a fair amount of confidence in
their clergy or other religious leaders to provide this guidance. Similar shares
have confidence in the guidance they receive from public health officials,
such as those at the Centers for Disease Control and Prevention (CDC), or
their primary care doctors (77% and 80%, respectively). Among all U.S. adults
who regularly attend religious services, 61% trust their religious leaders to
provide guidance on the vaccines. (PEW) OCTOBER 15, 2021 711-712-43-34/Polls Pandemic Within A Pandemic: Most (69%) Believe There Is A Mental
Health Pandemic In Canada
Toronto, Ontario, October 4, 2021 — As
the COVID-19 pandemic continues to wreak havoc across Canada, the results of
a new Ipsos poll conducted on behalf of Ontario Shores Centre for Mental
Health Services suggests that we may be dealing with another pandemic, within
the coronavirus pandemic. The poll reveals that most (69%) Canadians believe
there is a mental health pandemic in their country. Millennials and Gen Xers
are among the most likely to believe that Canada is facing a mental health
pandemic (75% vs. 61% of Gen Zers & Boomers).
After months of lockdowns and restrictions, job loss, anxiety, and
isolation from family and friends, it is perhaps not surprising that many
Canadians are now experiencing mental health issues. Nearly three in ten
(28%) admit that their mental health has deteriorated, over the course of the
pandemic.
(Ipsos Canada) 4 October 2021 711-712-43-35/Polls Four In Ten (40%) Working Canadians Say They’ve Experienced A Decline
In Their Physical Health Throughout The Pandemic
Toronto, ON — As
vaccination rates have ramped up across the country, and businesses are
starting to prepare for a post-pandemic future, working Canadians continue to
face a number of health-related challenges. Four in ten (40%) working
Canadians say they’ve experienced a decline in their physical health
throughout the pandemic, according to a recent Ipsos poll conducted on behalf
of RBC Insurance. The inability to socialize with family, friends or
co-workers (72%) and work-related stress (58%) were also cited as factors
impacting overall health. Barriers Remain for Some Workers Throughout the pandemic, working Canadians with chronic health issues
have faced increased barriers receiving the care they need, with over six in
ten (63%) noting the inability to visit a doctor or healthcare clinic has
negatively impacted their health. Those with a chronic health issue are more
likely to cite this compared to those without a chronic health issue (47%). Although a majority (58%) of working Canadians with a chronic health
issue or disability say their condition would deteriorate further without
their workplace benefits plan, four in ten (40%) say they have also
experienced challenges accessing their employees benefits due to their unique
needs. Half (49%) of younger working Canadians say that their employer’s
benefit plans have not adequately met their heath and wellness needs in the
past year. Virtual Care Solutions Useful for Employees
with Disabilities or Health Issues Among those who have group benefits or private coverage, Canadian
employees with a disability or a chronic heath issue are more likely to have
access to virtual care tools (48% and 51% respectively) compared to those who
do not. As well, those with a chronic health issue are more likely to agree
that using virtual tools to connect with mental health support has been
useful (64% vs 50% with no chronic health issue). High Expectations on Employer Benefits A majority (68%) of working Canadians say they have positive feelings
towards their employer. Though, a majority (68%) of Canadians say they would
take a job with a good benefits plan over another job that pays more but does
not have a benefits plan. (Ipsos Canada) 5 October 2021 AUSTRALIA
711-712-43-36/Polls Inflation Expectations Up 0.2% Points To 4.5% In September; Highest
For Three Years Since October 2018
In September 2021 Australians expected inflation of 4.5% annually
over the next two years, up 0.2% points and the highest Inflation
Expectations for three years since October 2018. Inflation Expectations are
now a large 1.2% points higher than a year ago in September 2020 (3.3%). Inflation Expectations are still 0.2% points below their long-term
average of 4.7% but are now a full 1% point higher than the record low 2020
monthly average of 3.5%. Inflation Expectations are up the most for
Australians aged under 60 A look at Inflation Expectations by Generations shows there is now
agreement between people of different ages about how much prices are set to
rise. However, the change from a year ago is starkly different for people
over 60 (Pre-Boomers and Baby Boomers) and those under 60 (Gen X, Millennials
and Gen Z). Inflation Expectations have increased across the board but have
increased most rapidly for Australians aged under 60 – led by Millennials –
up 1.6% points from a year ago to 4.5% in September. Generation X, now aged from 45-60, have the highest Inflation
Expectations at 4.6% in September, an increase of 1.3% points from a year
ago. The Inflation Expectations of Generation Z have also increased
significantly, up 1.2% points to 4.5% - matching the increase of Australians
overall. Although Inflation Expectations for Baby Boomers are in line with the
national average at 4.5% this is an increase of only 0.7% points from a year
ago while older Australians, aged 75+, the Pre-Boomers, now have the lowest
Inflation Expectations at 4.2%, up only 0.6% points from a year ago. Inflation Expectations by Generation:
September 2020 cf. September 2021 Source: Roy Morgan Single Source: September 2020,
n=6,092, September 2021, n=6,035. Base: Australians
14+. Inflation Expectations are again highest in
Tasmania and lowest in South Australia On a State-based level Inflation Expectations are highest and well
above the national average in Tasmania at 5.1%. Inflation Expectations are
above the national average in New South Wales at 4.7% as the State prepares
to re-open. Inflation Expectations are in line with the national average in both
Queensland and Western Australia at 4.5% and slightly below the national
average in locked down Victoria at 4.4%. The outlier this month is again South Australia which has the lowest
Inflation Expectations of only 4.0%, the fourth straight month the measure
has been lower in South Australia than anywhere else. The ANZ-Roy
Morgan Consumer Confidence Rating for September was at 101.6, an increase of
9.8pts (+10.7%) from September 2020 a year ago. The latest Consumer
Confidence figure for the first week of October has continued to improve and
is now at 104.6 as re-opening plans for Greater Sydney have been brought
forward under new Premier Dominic Perrottet. Inflation Expectations Index long-term
trend – Expected Annual Inflation in next 2 years
See below for a comprehensive list of RBA interest rate changes
during the time-period charted above.
“Inflation Expectations increased by 0.2%
points to 4.3% in September and are now up 1.3% points from the low-point
reached just over a year ago in August 2020 (3.2%). This is the biggest ever
sustained increase in Inflation Expectations since the index began in 2010,
beating an increase of 1.2% points during the ‘Mining Boom’ in 2010-11. “The increasing Inflation Expectations come
despite over half of Australia’s population being in lockdown throughout the
month of September although we are fast approaching the end of these
lockdowns. Greater Sydney has already reached a full vaccination rate of over
70% and is set to emerge from lockdown this week while the ACT and Greater
Melbourne are set to finish their current lockdowns later in October. “The end of the lockdowns is widely
predicted to lead to a surge in retail spending in the closing months of the
year as millions of people in Sydney and Melbourne have built up their
savings during lockdown without being able to spend their earnings as they
are accustomed to. “A look at Australians by generation shows
that although Inflation Expectations are relatively similar across the age
groups at present in September, they are increasing far faster for younger
generations. Compared to a year ago the Inflation Expectations of Generation
X (+1.3% points), Millennials (+1.6% points) and Generation Z (+1.3% points)
have increased rapidly. “The older generations, representing people
aged 60+, have seen far smaller increases in Inflation Expectations compared
to a year ago – up by 0.6% points for Pre-Boomers and up by 0.7% points for
Baby Boomers. “These results indicate that working
families and younger Australians are most keenly impacted by rising prices
across the economy. As the Australian economy re-opens over the next few
months and over 10 million Australians are released from lockdown and able to
spend their money at a greater rate it is likely inflationary pressures will
grow. “Although Australia is yet to fully re-open
there are several comparable countries overseas in Europe and North America
that have emerged from lockdowns earlier in the year and are also seeing
inflationary pressures growing significantly. “The likelihood inflationary pressures will
continue to increase once the lockdowns are over adds another element to the
existing issues relating to mandatory vaccinations, vaccine passports, and
the re-opening of domestic State borders that the Federal Government will be
forced to ‘grapple’ with in the run-up to the next Federal Election due early
in 2022.”
The Roy Morgan Consumer Confidence Report –
Including Inflation Expectations
(Roy Morgan) October 11 2021 711-712-43-37/Polls Movement In The Sydney CBD At Only 17% Of Pre-Pandemic Levels Before
Greater Sydney Prepared To Leave Lockdown
The average 7-day movement level in the Sydney CBD hit a low of 8% of
pre-pandemic levels in late July and have slowly increased since then as
restrictions have been eased as vaccination rates have increased rapidly.
Late last week NSW hit a mark of 70% of the population aged 16+ being fully
vaccinated which is the mark that was set for the ending of the lockdown of
Greater Sydney this week.
Australian Capital City CBDs average 7-day
movement levels March 1, 2020 – October 3, 2021:
The latest vaccination figures from the Health
Department show over 30 million vaccination doses have now been
administered to 82% of the adult population. The figures show that over 60%
of Australian adults are now fully vaccinated including over 70% of the adult
population in NSW and the ACT.
“Vaccination rates in Australia have
increased rapidly over the last two months while over 15 million Australians
in NSW, Victoria and the ACT have been in lockdown. The quick uptake of
vaccines during this period means over 90% of adults in NSW and the ACT, and
over 85% of adults in Victoria, have had at least one vaccine shot. “These high rates of vaccination are behind
the re-opening of Greater Sydney this week and the re-opening of Canberra set
for later this week with over 70% of adults in both cities now fully
vaccinated. “Over the weekend Prime Minister Scott
Morrison flagged the bringing forward of international travel for people in
NSW to be available when over 80% of adults in NSW are fully vaccinated. This
mark is projected to be achieved next week and in early November it may well
be easier for someone from Sydney to travel to London or Los Angeles than
Perth or Brisbane. “Clearly the success, or otherwise, of the
re-opening of Greater Sydney will have a big impact on the re-opening of
Melbourne later in October as well as the full re-opening of domestic borders
for States such as Queensland, WA, SA and Tasmania. “Some States, notably Queensland, WA and
Tasmania, have suggested they will not fully re-open their borders until 90%
of their adult populations are fully vaccinated. At current rates that level
of vaccination is unlikely to occur until early 2022 in States such as
Queensland and WA. “However, the Federal Government is
counting on the freedom to travel internationally from Sydney in the next
month putting pressure on other States to accelerate their plans to fully
re-open their economies and borders as part of a transition to
‘COVID-normal’. “The ending of restrictions, including
lockdowns, closed borders and mandatory mask-wearing are all key factors in
increasing the return of people to the CBDs of Australia’s Capital Cities –
and particularly the Sydney and Melbourne CBDs. “Over the next few months we will continue
to closely track the level of movement in Australia’s Capital City CBDs
including whether movement in a re-opened Sydney CBD can bridge the gap with
counterparts in Brisbane, Perth, Adelaide and Hobart currently free of
COVID-19.” (Roy Morgan) October 11 2021 711-712-43-38/Polls Sydney FC Is The Most Widely Supported A-League Club As Support Rises
For The League Overall
Close behind in second place are traditional rivals Melbourne Victory with 632,000
supporters, an increase of 46% on a year ago. The Victory have been the second most
successful club in the A-League Men winning 4 Championships with their most
recent win in the 2017-18 season.
A-League Club Supporter Ladder 2021
Over 3.6 million Australians now support an
A-League club, up over 1 million on a year ago
“A-League clubs have enjoyed a substantial
increase in support over the last year in line with the increases seen for
other football codes such as the AFL and NRL. Over 3.6 million Australians
now profess support for an A-League club, an increase of over 1 million (+38.3%)
on a year ago. “As we have seen across other football
codes the COVID-19 pandemic has forced many sports to be played in front of
empty stadiums but live on TV to supporters stuck at home in the many
lockdowns we have seen over the last 18 months around Australia. “The biggest winners have been the most
successful A-League clubs Sydney FC and Melbourne Victory – both of whom
have increased their supporter bases by over 150,000 compared to a year
ago. Sydney FC grew
their support by 32.2% to 640,000 to be just ahead of Melbourne Victory with 632,000
supporters, an increase of 46%. “Sydney
FC has won 5 A-League Men Championships, including three in
the last five years (2016-17, 2018-19 & 2019-20), while Melbourne Victory are in second
place with 4 A-League Men Championships including their most recent win in
2017-18. “Another big winner over the last year has
been Melbourne City which
won its first A-League Men Championship earlier this year after
defeating Sydney FC in
the Grand Final (between Melbourne’s fourth and fifth lockdowns) in late
June. Melbourne City’s
support has increased by an impressive 50.9% on a year ago to 249,000 to have
the highest support of any A-League Men expansion team. “The newest club in the A-League Men, Macarthur FC, has had a successful first
season in the league with a finals appearance, a victory in an Elimination
Final, and a loss to eventual Champions Melbourne City in the semi-final. Not only has Macarthur FC performed strongly on
the pitch but they have already attracted 84,000 supporters to rank in tenth
place overall. “Looking ahead, the challenge for the
A-League will be to continue to grow the league in an increasingly
competitive sporting market and find a way to connect with the millions of
Australians who love their football but don’t presently engage with the
A-League. There are over 2 million Australians out there who watch high
quality football competitions, such as the English Premier League, who are
yet to become fans of the A-League. This at-hand market of 2 million
Australians is a significant market for the A-League to target during the
recovery from Covid-19.” (Roy Morgan) October 12 2021 Source: https://www.roymorgan.com/findings/8818-a-league-supporter-ladder-2021-202110120022 711-712-43-39/Polls Support For New Zealand’s Labour/Greens Government Increased 3.5%
Points To 55% In September
The governing parties are now 14% points ahead of the Parliamentary
opposition National/Act NZ/ Maori Party on 41%, up 0.5% points since August.
The increase was driven by another rise in support for Act NZ up by 3% points
to 16%. This is a new record high in
support for Act NZ. In contrast, support for National was down 2%
points to 23%, the lowest since March 2021. Support for the Maori Party was
down 0.5% points to 2%.
The latest ANZ-Roy
Morgan Consumer Confidence Rating was down by 5.1pts to 104.5 in September and
is only slightly above the latest Consumer
Confidence figure in Australia of 103.7 on September 25/26, 2021 as
Australia continues to battle outbreaks of COVID-19 in Sydney and Melbourne. Women continue to favour Labour-Greens
while men favour National-Act NZ Prime Minister Jacinda Ardern’s strength lies with the massive edge
in support that the Labour Party receives from women. Nearly two-thirds of
women (64.5%) support either Labour (54%) or the Greens (10.5%) compared to
only 46% of men supporting either Labour (37.5%) or the Greens (8.5%) – a
massive ‘gender gap’ of 16.5% points in favour of Ardern’s Labour Party among
women.
Party vote analysis by Gender
*The Roy Morgan Government Confidence
Rating is 100 plus the difference between the percentage of Kiwis who say the
country is “heading in the right direction” and the percentage who say the
country is “seriously heading in the wrong direction”. “Today’s Roy Morgan New Zealand Poll shows
the Labour-led Government has the support of 55% of New Zealand electors in
September, up 3.5% points from August. The increase was driven by the jump in
support for the Labour Party, up 6% points to 45.5% - the highest support for
six months since March. Support for the Greens was down 2.5% points to 9.5%. “Support for the Parliamentary Opposition
was up 0.5% points to 41% in September with increasing support for Act NZ
driving the improvement, up by 3% points to 16%. Support for the main
Opposition National was down 2% points to 23% and support for the Maori Party
was down 0.5% points to 2%. “The big mover so far this year has been
Act NZ which has now more than doubled it’s 2020 election result of 7.6%. Act
NZ’s support of 16% is at a record high level and is based firmly upon their
support amongst men which is now at 22.5% - up 5% points from August. In
contrast only 9.5% of women support Act NZ, an increase of 1% point. “In the last two months New Zealand’s
largest city of Auckland has been in a strict lockdown to supress the highly
contagious Delta variant. In addition to the restrictions introduced to deal
with the outbreak there has been a rapidly increasing vaccination rate in New
Zealand. “In the last week New Zealand’s first dose
vaccination rate (68% of the whole population) has overtaken both the United
States (64%) and Germany (67.5%) – two countries with minimal restrictions.
It’s true both the US and Germany have higher rates of full vaccination but
the rapid uptake of vaccinations in New Zealand will see the country soon
overtake these countries for full vaccination as well. “The high rate of vaccination in New
Zealand will lead to a relaxation in restrictions in the next few months with
existing border controls to be reconsidered at the end of November. “Prime Minister Jacinda Ardern’s commitment
to minimising the spread of COVID-19 has been endorsed by electors during
September while Act NZ’s focus on opening up and learning to live with COVID
is also clearly attracting support. “Act NZ leader David Seymour released a
plan entitled ‘Covid 3.0: Life after lockdown’ outlining Act NZ’s plan to
re-open the New Zealand economy and allow people to travel in and out of the
country before Christmas. The plan would also mean an end to regional or
national lockdowns and having a wider focus on overall well-being rather than
the concentrating on COVID-19 at the expense of other issues such as mental
health. “The record high level of support for Act
NZ suggests the call to re-open the New Zealand economy is bringing in new
supporters to the centre-right party.”
Roy Morgan NZ Government Confidence Rating
vs. ANZ-Roy Morgan NZ Consumer Confidence
Voting Intention Summary The following table compares the latest New Zealand Roy Morgan Polls
on Voting Intention with the result from the September 23, 2017 General
Election:
*The 1996 Election was the first New
Zealand Election contested via MMP (Mixed Member Proportional). At the 1996
Election the Greens Party contested as part of the “Alliance” political
grouping with four other political parties. Two-Party Preferred: Labour Party-led
Government vs. Parliamentary Opposition Parties
*At the 2020 NZ Election the Labour party
secured 50.01% of the vote which was enough to govern in their own right but
Labour opted to sign a ‘Cooperation Agreement’ with the Greens, who won 7.86%
of the vote. There were three Parties elected to Parliament not in Government
led by National (25.58%), Act NZ (7.59%) and the Maori Party (1.17%). (Roy Morgan) October 04 2021 Source: https://www.roymorgan.com/findings/8809-nz-national-voting-intention-september-2021-202110040446 MULTICOUNTRY
STUDIES
711-712-43-40/Polls On Average, Eight In 10 (79%) Across 30 Countries Say That Their
Mental And Physical Health Are Equally Important
How often do you think about your
mental/physical wellbeing? While over half (53%) across all countries say that they think about
their mental wellbeing ‘fairly’ or very’ often, people tend to think about
their physical wellbeing more frequently (68% fairly/very often). One in ten
(11%) say they never think about their mental health, compared to 5% for
physical health. Women tend to think about their mental health more than men do (58%
very/fairly often vs. 48%). We also see some generational differences; 61% of
under-35s think about their mental wellbeing at least ‘fairly often’,
compared to 42% of over-50s. Demographic differences are less pronounced when it comes to how
often people think about their physical health. The countries where people report thinking about their mental health
most often are Brazil (75%), South Africa (71%), and Colombia (71%). In China, South Korea, Russia, Germany, the Netherlands, France and
Sweden, people are more likely to say that they do not think about their mental
wellbeing very often. How important are mental and physical
health to you? On average, eight in 10 (79%) across 30 countries say they consider
their mental and physical health to be equally important when it comes to
their personal health. We find greatest proportions saying they are ‘equally important’ in:
Among those who think one is one more important than the other, more
people are likely to select mental health (12%) than physical health (6%). The countries with the largest proportions of people saying that
mental health is most important are Saudi Arabia (26%), India (24%), Sweden
(20%), Turkey (18%), and Brazil (16%). The countries with the largest proportions of people saying that
physical health is most important are Saudi Arabia (14%), India (13%), Japan
(10%), China (10%), and Australia (10%). How are mental and physical health treated
in healthcare systems? Despite widespread agreement that mental and physical health are
equally important to an overall picture of health, people are less likely to
think that their country’s healthcare systems treat them equally: 35%
globally say this is the case, while 42% say that physical health is treated
with greater importance. Only 9% think that mental health is treated as more
important. There is strongest agreement that physical health is treated with
greater importance in:
The countries where more think that both mental and physical health
are treated as equally important are:
This points to a discrepancy when it comes to how the public perceive
their own health and how it is treated by healthcare services in their
country: only 6% say that their physical health is more important than their
mental health but 42% think that this is treated with greater importance. Mental health as a top global health
concern Our global average across 30 countries sees mental health emerge this
year as the third most important health problem facing the public in their
country. Almost a third (31%) see this as a top health issue, only 3 points
shy of the figure recorded for cancer (34%). The top health concern in 2021
is Coronavirus (70%), continuing what we saw last year when it was first
introduced in the survey. Mental health is the top health concern in Sweden (63%) and Chile
(59%). After these two, the countries that are particularly likely to say
mental health is a key health concern are: Australia (47%), Canada (43%),
Colombia (41%), Singapore (40%), Brazil (40%), and Great Britain (40%). The countries where fewer members of the public consider mental
health an important health concern are Japan (9%), Mexico (11%), France
(12%), and Saudi Arabia (14%). (Ipsos Egypt) 8 October 2021 Source: https://www.ipsos.com/en-eg/world-mental-health-day-2021 711-712-43-41/Polls Italians And The French Are The Most Pessimistic With One In Five
(19% And 20% Respectively) Saying That It Is Already Too Late To Avoid The
Worst Effects Of Climate Change
World leaders are set to descend on Glasgow at the end of the month
for COP-26, a global summit on measures countries could take to combat
climate change. YouGov's latest Eurotrack survey looks at what Europeans in
seven countries think of the summit’s chances of success, as well as wider attitudes
to climate change. Most are worried about climate change, but
also think there is still time to fix things Climate change is a sizeable concern across the countries studied. A
majority of adults in Italy (84%), Spain (79%), France (79%), Germany (70%),
Denmark (68%), Sweden (66%) and Britain (65%) all say they are worried about
climate change and its effects.
Italians and the French are the most pessimistic about what can be
done to tackle climate change, with one in five (19% and 20% respectively)
saying that it is already too late to avoid the worst effects. Spaniards have
the most positive outlook, with just 1 in 11 (9%) saying it is too late, and
three quarters (73%) saying that the worst effects can still be avoided if
drastic actions are taken. Swedes are the most likely to think current actions are enough, with
1 in 6 (17%) saying that the steps currently being taken are sufficient to
avoid the worst effects of climate change – Sweden is a leader in climate
change action and is a frontrunner in the
Climate Change Performance Index, thanks to its climate change policies.
However, according to the Index no country is doing enough to prevent
dangerous climate change, with no country achieving a 'very high' rating. Countdown to COP-26 While COP-26 is the most major climate change event in the last
couple of years, awareness of the conference is low across all countries
polled. Britons and French people display the highest levels of awareness,
but even here just a quarter (27% and 26% respectively) had heard a great
deal or fair amount about COP-26 at the time the survey was conducted in
mid-September. Awareness was lowest amongst the two Nordic countries, with
just 6% of Danes and 7% of Swedes saying they have heard about the
conference. Despite the importance of the issue, and the involvement of the most
powerful world leaders in seeking a solution, a majority in all seven
countries think the conference is unlikely to result in any significant action
being taken. Germans are the most pessimistic about what the conference can
achieve, with 64% saying significant action is unlikely.
Can individuals make an impact on climate
change? Although the public have little confidence that COP26 will result in
significant action, they are sure that it is within the power of governments
to make an impact on climate change. In all countries, at least seven in ten
think governments, as well as businesses, can have a big or fairly big impact
on tackling climate change. Italians and Spaniards are most confident in this
view – 84% of Italians say governments can have a big impact, while 86% of
Spaniards think the same of businesses. While the conference will focus on actions governments can take to
affect global warming, can individuals also make a difference? The seven
countries polled are split on the role individuals can play. Italians are the
most confident that people themselves can make a difference, with three
quarters (75%) say that individuals can have a big or fairly big impact.
Danes are the least optimistic, with only 43% thinking people can make much
of an impact at the individual level.
Majority think climate change should be a
government spending priority One of the key criticisms of governments in their commitment to
tackling climate change is that they have not invested enough in finding
solutions. Particularly in the wake of the coronavirus, the defence has been
that the public would rather government spending was focused on other areas,
but the latest Eurotrack data shows that this is not the case. In all countries, the proportion of adults who feel climate change
needs to be treated as a priority in terms of government spending outweighs
the proportion that think spending on other areas should be more urgent. The
gap is biggest in Italy, where half (50%) think climate change spending
should be a priority, almost double the proportion that think other areas are
more urgent than climate change (27%).
(YouGov UK) October 12, 2021 711-712-43-42/Polls A Global Country Average Of 64% Rate Doctors As Trustworthy
The Ipsos' Global
Trustworthiness Index has reported the level of trust
afforded to many types of professionals since 2018, providing comparisons
between the pre-pandemic world and where we are today. Across 28 markets
around the world, a Global Country Average of 64% rate doctors as
trustworthy, followed by scientists at 61% and teachers on 55%. On foot of
the trust table, only 10% on average believe politicians are trustworthy, 14%
say the same about government ministers, and 15% advertising executives. While many professions’ positions have barely shifted over the last
few years, one notable impact during the pandemic has been a boost to the
standing of doctors, moving them above scientists who were the top profession
in previous waves. On average, almost two-thirds of those in 22 countries
which have been studied over the three waves rate them as trustworthy (64%),
an increase of seven percentage points since 2019 and nine points ahead of
their score in September 2018. By contrast, the proportion saying the same
about scientists has stayed at about six in ten across all three years (61%
in 2021). Great Britain leads the world in trusting doctors with 72 per cent
rating them as trustworthy, a proportion which has risen slightly since 2018
(67%). Doctors are similarly highly trusted by Dutch people (71%) and
Canadians (70%). Yet the biggest changes in trust in doctors over the past few years
are seen elsewhere:
Many other professions remain at similar levels to those recorded in
pre-pandemic waves, including politicians, who have been bottom of the list
in all three years. This year just ten per cent on average rate politicians
as being trustworthy. Scientists remain
seen as trustworthy by six in ten of the global sample (61%) and their
ratings have stayed the same in many markets over the past two years. The
largest increases in trust in scientists since 2019 have been recorded in
Saudi Arabia (+17ppt), Hungary (+13ppt), Brazil (+9ppt) and Canada +8ppt),
while the biggest drops have been in Argentina (-11ppt) and Mexico (-8ppt). Teachers remain
the third-most trustworthy profession for the third wave in a row, with 55%
rating them as trusted. As with scientists, in many countries trust scores
for teachers have moved little through the pandemic, but there has been a
sixteen percentage-point increase in trust for teachers in Saudi Arabia
between 2019 and 2021, as well as nine point rises in Hungary and Japan. Over
the same period perceptions of trustworthiness have improved in Malaysia
(+8ppt), Italy and South Africa (+6ppt), while they have fall in the US
(-6ppt) and Argentina (-5ppt). Globally, three professions stand out as the least likely to be
considered trustworthy: government ministers, advertising executives and
politicians. This year the Global Country Average has 14% scoring government
ministers and 15% advertising executives one or two out of five for
trustworthiness and just 10% doing the same for politicians. While these
scores are similar to previous years, the level of distrust in these professions
has fallen somewhat. Between 2019 and 2021 the proportion who see politicians
as untrustworthy across 22 countries has fallen four points from 66% to 62%,
while distrust of government ministers has dropped by five percentage points
(from 58% to 53%). Advertising executives have also seen a shift; in 2019
nearly half considered them untrustworthy (45%) but now that figure stands at
four in ten (39%). (Ipsos Egypt) 12 October 2021 Source: https://www.ipsos.com/en-eg/global-trustworthiness-index-2021 711-712-43-43/Polls Diversity And Division In Advanced Economies
Wide majorities in most of the 17 advanced economies surveyed by Pew
Research Center say having people of many different backgrounds improves
their society. Outside of Japan and Greece, around six-in-ten or more hold
this view, and in many places – including Singapore, New Zealand, the United
States, Canada, the United Kingdom, Australia and Taiwan – at least eight-in-ten
describe where they live as benefiting from people of different ethnic
groups, religions and races. Even in Japan and Greece, the share who think diversity makes their
country better has increased by double digits since the question was last
asked four years ago, and significant increases have also taken place in most
other nations where trends are available. Alongside this growing openness to diversity, however, is a
recognition that societies may not be living up to these ideals: In fact,
most people say racial or ethnic discrimination is a problem in their
society. Half or more in almost every place surveyed describe discrimination
as at least a somewhat serious problem – including around three-quarters or
more who have this view in Italy, France, Sweden, the U.S. and Germany. And,
in eight surveyed publics, at least half describe their society as one with
conflicts between people of different racial or ethnic groups. The U.S. is
the country with the largest share of the public saying there is racial or
ethnic conflict. Notably, however, in most societies racial and ethnic divisions
are not seen as the
most salient cleavage. Rather, in the majority of places surveyed, more
people identify conflicts between people who support different political
parties than conflicts between people with different ethnic or racial
backgrounds. Political divisions are also seen as greater than the other two
dimensions tested: between those with different religions and between urban
and rural residents. (For more on the actual composition of each public
surveyed on each of these dimensions, see Appendix
A.) In the U.S. and South Korea, 90% say there are at least strong
conflicts between those who support different parties – including around half
or more in each country who say these conflicts are very strong. In Taiwan, France and
Italy, around two-thirds say the political conflicts in their society are
strong. Still, in around half of the surveyed publics, fewer than 50% say the
same. In some places, this acrimony has risen to the level that people
think their fellow citizens no longer disagree simply over policies, but also
over basic facts. In France, the U.S., Italy, Spain and Belgium, half or more
think that most people in their country disagree on basic facts more than
they agree. Across most societies surveyed, those who see conflict among
partisans are more likely to say people disagree on the basic facts than
those who do not see such conflicts. Views on the topic are also closely related to views of the governing
party or parties in nearly every society (for more on how governing party is
defined, see Appendix
B). In every place but the U.S. and Italy, those with unfavorable views
of the governing coalition are more likely to say most people disagree on the
basic facts than those with favorable views of the government. Although divisions between racial and ethnic groups as well as
between partisans are palpable for many, other types of conflicts are less
commonly perceived. For example, in no place surveyed does a majority think
there are strong conflicts between people who live in cities and people who
live in rural areas. Similarly, only a minority in most countries say there
are divisions between people who practice different religions – though around
half or more do sense such conflicts in South Korea, France and the U.S. Beyond divisions between specific groups, there is also a widespread
– and growing – sense that societies are more divided now than they were
before the COVID-19 pandemic. A median
of 61% across the 17 advanced economies say they are now more
divided than before the outbreak, and in all but one of the 13 countries also
polled in summer 2020, the sense that societies are more divided than united
has risen significantly since last year. Those who describe their society as
more divided than before the global health emergency are also significantly
more likely to see conflicts between different groups in society and to say
their fellow citizens disagree over basic facts. Spotlight: Divided societies In the U.S., France and South Korea, at least a majority say that
having people of many different backgrounds makes their country a better
place to live. Still, these three countries stand out for the degree to which
people perceive various conflicts. In each of these places, the publics are
among the most likely to describe their society as divided, and this is the
case across each of the dimensions asked about: political, racial and ethnic,
religious, and geographic. United States When it comes to perceived political and ethnic conflicts, no public
is more divided than Americans: 90% say there are conflicts between people
who support different political parties and 71% say the same when it comes to
ethnic and racial groups. (Results
of a different question asking specifically about conflicts between
Democrats and Republicans also found that 71% of Americans think conflicts
between the party coalitions are very strong and another 20% say they are
somewhat strong. The sense of conflicts between Democrats and Republicans
also increased between 2012 and 2020.) In terms of divisions between people who practice different religions
and between urban and rural residents, again, Americans consistently rate as
one of the three most divided publics of the 17 surveyed. Some of these perceived divisions differ by racial and ethnic
background. For example, more Black adults (82%) see conflict between people
with different ethnic or racial backgrounds than White (69%) or Hispanic
(70%) adults. Another major axis of division in the U.S. is partisan
identification. Democrats and independents who lean toward the Democratic
Party are much more likely to see conflict between people of different racial
and ethnic groups than are Republicans and independents who lean Republican.
There are also partisan differences in opinion over whether people who
practice different religions or those who live in urban and rural areas have
conflicts. Notably, however, both Democrats and Republicans share a widespread
belief that there are conflicts between those who support different political
parties. Democrats and Republicans are also equally likely to say Americans
disagree over basic facts. For more, see “Americans
see stronger societal conflicts than people in other advanced economies.” France On three of the four dimensions asked about, French adults are among
the most likely to say there are conflicts – and the highest share in France
perceives divisions between rural and urban residents. Partisanship plays
some role in perceived divisions. Supporters of the Republicans, a
right-of-center party, tend to see more conflicts than supporters of the
Socialist Party or the ruling En Marche. For example, 76% who support the
Republicans say there is conflict between people of different racial or
ethnic groups, compared with 56% of Socialist Party supporters or 54% of En
Marche supporters.1 French
women are also more likely to see conflicts in many parts of their society
than are men. South Korea More in South Korea than in any other public surveyed say there are
conflicts between people who practice different religions (61%) in their
society. They are also tied with the U.S. as the society where the highest
share sees partisan divisions: 90% of South Koreans say this, including 50%
who say such conflicts are very strong. And, on issues between ethnic and
racial groups and between rural and urban residents, South Korea is
consistently one of the top three most divided publics. There is no single pattern to the divisions that South Koreans
perceive in their society. Rather, depending on the conflict in question,
different cleavages emerge. For example, when it comes to conflicts between
rural and urban residents, those with lower incomes are more likely to
identify conflicts than those with higher incomes. Younger South Koreans, for
their part, are more likely to say there are racial or ethnic conflicts in
their society than are older people, and those with higher education levels
also agree relative to those with lower education levels. Spotlight: Societies with fewer divisions Singapore The small island nation of Singapore is one of the least divided
societies surveyed. Although it is ethnically
and racially diverse – and even boasts four official languages that
correspond with the dominant ethnic groups – fewer Singaporeans (25%) report
conflicts between people of different ethnic and racial backgrounds than
nearly any other public surveyed. Singaporeans are also among the least
divided religiously, with only 21% saying there are conflicts between people who
practice different religions, despite being quite heterogeneous
religiously. Notably, however, perceived divisions vary based on people’s
self-reported ethnic and religious identity. For example, ethnic Indians and
Malays are more likely to see political, ethnic and religious conflicts than
ethnic Chinese. Similarly, Muslims are somewhat more likely to see conflicts
both between those who practice different religions and those of different
racial and ethnic groups than are self-reported Buddhists or
Christians. Singapore also stands out for seeing the fewest divisions between
people who support different political parties (33%). The nation-state
is largely
governed by the People’s Action Party, which garnered around 61% of the
vote and 89% of parliamentary seats in the most recent 2020 election, with
the Worker’s Party securing the remainder. Singaporeans were not asked about
conflicts between rural and urban residents because the nation-state is
entirely urban. Spain Spaniards are the least divided among the 17 publics surveyed when it
comes to geography, with only 12% of the public saying there are conflicts
between rural and urban residents. Only 19% report conflicts among those who
practice different religions, making it one of the two least religiously
divided societies. And only around a third see conflicts between those with
different racial and ethnic backgrounds, which ranks the country in the
bottom three for this division as well. Still, when it comes to partisan
differences, Spaniards see more conflicts. This
country – which has active separatist
movements, and has seen
the collapse of the two-party system and the rise
of populist parties – is one where a 58% majority see at least some
conflict between those who support different political parties. Spaniards on
the ideological left are somewhat more likely than those on the right to
describe conflicts between partisans. Taiwan The share of adults in Taiwan who say there are conflicts between
people who practice different religions (12%) is smaller than the share who
say the same in any of the other places surveyed. They are also among the
least likely to report conflicts between rural and urban residents (15%) and
between those with different racial and ethnic backgrounds (22%). Still,
adults in Taiwan do see major divisions between those who support different
political parties: 69% say there are conflicts, which ranks the island among
the top three most politically divided locations. Supporters of the governing
Democratic Progressive Party (DPP) and nonsupporters are equally likely to
see such political disagreements. These are among the findings of a new Pew Research Center survey,
conducted from Feb. 1 to May 26, 2021, among 18,850 adults in 17 advanced
economies. Other key findings include:
Diverse society seen positively in most
advanced economies Across most of the 17 advanced economies surveyed, majorities – and
in many cases, large majorities – say that having people of many ethnic
groups, religions and races makes their society a better place to live. This
opinion is most strongly held in Singapore, where 92% say that having people
of different ethnic groups, religions and races makes Singapore a better
place to live. Eight-in-ten or more in New Zealand, the U.S., Canada, the UK,
Australia and Taiwan also say having people of many different backgrounds
makes for a better place to live. But this opinion is not universally held. About half of Greek and
Japanese adults say that having a diverse society makes their country a worse place to live. Still, this
represents significant declines from 2017, when majorities in Greece (62%)
and Japan (57%) said diversity makes their country a worse place to live. In fact, attitudes have generally become more open to diversity since
the question was last asked in 2017. The share who say having people of many
different backgrounds makes their society a better place to live has
increased significantly in nine of 11 countries where the question was posed
in both 2017 and 2021. Views have changed most dramatically in Greece, where
45% now say having people of many different backgrounds makes their society
better compared with just 21% who held that view in 2017, an increase of 24
percentage points. While majorities in nearly every survey public agree that diversity
in society is a positive, younger people and those with more education are
significantly more likely than older people and those with less education to
hold this opinion. For example, 84% of Italians ages 18 to 29 say having people of many
different backgrounds makes Italy a better place to live, while about half
(51%) of Italians ages 65 and older agree. Italy also has the largest
attitudinal gap between those with a postsecondary education or more and
those with less than a postsecondary education: 89% of more educated Italians
view diversity positively, compared with 58% of educated Italians with less
education, a gap of 31 points. Wealthier people express more positive views of diversity than those
with lower incomes in some of the places surveyed. For instance, nine-in-ten
Britons with higher incomes say having people of many different ethnic
groups, races and religions makes the UK a better place to live; eight-in-ten
Britons with lower incomes say the same. Income gaps also appear in Italy,
Australia, France, Belgium, Sweden, Canada, Singapore and the U.S. And in 12 of 17 advanced economies, those who say the current
economic situation is good are significantly more likely to say diversity
makes their society better than those who say the economic situation is bad. Large divides on the question appear between supporters and
nonsupporters of right-wing populist parties in Europe, many of which
advocate for strict anti-immigration policies and openly oppose
multiculturalism (for more on how populist parties are defined,
see Appendix
C). The divide is largest between those with favorable and unfavorable
views of Sweden
Democrats (48% vs. 89%, respectively). On the other hand, supporters of center and left-wing populist parties
in Italy, Greece, France and Spain are more likely
to say diversity makes their country a better place to live. Discrimination seen as a serious problem in
most advanced economies When it comes to racial and ethnic discrimination, a median of 67%
say it is a serious or very serious problem in their own society, though
views vary widely. Americans and Canadians generally agree that racial and ethnic
discrimination is at least a serious problem in their respective countries.
Around three-quarters of Americans think so, as do around two-thirds of
Canadians. Across Europe, a median of around seven-in-ten say discrimination
against people based on their race or ethnicity is a serious or very serious
problem, while only about a quarter think it is not too serious of a problem
or not a problem at all. Italy reports the highest percentage of adults who
say racial and ethnic discrimination is a very serious problem (46%). In the Asia-Pacific region, views on the topic vary more widely than
in Europe and North America. At least six-in-ten Australians and New
Zealanders say discrimination against people based on their race and
ethnicity is a serious or very serious problem in their country. Taiwan,
Singapore and Japan are the only places surveyed where majorities say
discrimination is either not too serious or not a problem at all. In 14 of the 17 advanced economies surveyed, younger people are
significantly more likely than older people to say racial or ethnic
discrimination is a very serious problem. This is is especially true in
Italy, where two-thirds of Italians ages 18 to 29 say racial or ethnic
discrimination is a very serious problem, while only about one-third of
Italians ages 65 and older say the same. Age gaps of 20 percentage points or more also appear in Spain,
Australia and New Zealand. Even in Japan, where only 7% overall say racial or
ethnic discrimination is a very serious problem, adults under 30 are 10
points more likely than those 65 and older to hold this view (13% and 3%,
respectively). While there are few differences in responses by education or income,
women are more likely than men to say racial or ethnic discrimination is a
serious or very serious problem in 13 of 17 publics surveyed. In keeping with previous findings that ideological
divisions in the U.S. are wider than in other countries, the U.S. is
by far the most ideologically divided on the question of racial and ethnic
discrimination. About two-thirds of Americans on the left say racial and
ethnic discrimination in the U.S. is a very serious problem; only 19% of
Americans on the right hold that view. Still, there are significant left-right divides in many other
countries on the seriousness of racial and ethnic discrimination.
Australians, Canadians and Italians on the left are more than 20 points more
likely than those on the right to say discrimination based on race or ethnicity
is a very serious problem in their country. Perceived social conflict To understand how people view divisions in their societies, we asked
about the strength of the conflict that people see between various groups,
including: 1) those who support different political parties, 2) those with
different ethnic or racial backgrounds, 3) those who practice different
religions and 4) those who live in cities compared with those who live in
rural areas. (For more on each society’s composition across these four
dimensions, see Appendix
A.) We created a summary index of perceived social conflict by averaging responses
across the four questions. Higher values indicate that, on average, people
see more friction between groups in their society. Perceived conflict is highest in the U.S., South Korea and France.
Notably, Koreans are much more likely than others in the Asia-Pacific region
to view conflict among social groups. Four of the five publics with the
lowest conflict scores are in this region: Singapore, Taiwan, Japan and New
Zealand. In contrast, conflict scores tend to be relatively higher in North
America and Europe. Here, Spain is the exception, with a generally low
average. Though the overall magnitude varies across the 17 publics surveyed,
most show the same pattern when it comes to which groups are more or less
likely to be divided. Overall, people see the strongest conflicts among those
who support different political parties and those with different ethnic or
racial backgrounds. In comparison, people tend to see less conflict among
those who practice different religions. And relatively few see strong tensions
between people who live in cities and people who live in rural areas. Perceived conflict between supporters of
different political parties A median of 50% across the 17 publics surveyed say there are strong
conflicts between people who support different political parties. This
sentiment is particularly high in the U.S. and South Korea, where nine-in-ten
see tensions between different party backers. At least half in both countries
say these conflicts are very strong. Compared with their southern neighbors, Canadians see their country
as much less divided across party lines. Only 44% think there are strong
partisan conflicts. (The survey was conducted before Canadian Prime Minister
Justin Trudeau called a snap
election in August 2021.) In Europe, majorities in France, Italy, Spain and Germany say there
are strong conflicts between supporters of different political parties. A
quarter or more in France and Italy see these tensions as very strong. Sweden
and the Netherlands are among the least politically divided countries in this
region, with 35% and 38% seeing strong conflicts, respectively. While people
in South Korea are the most likely in the Asia-Pacific region to see strong
conflicts between different party backers, nearly seven-in-ten in Taiwan hold
the same view. Relatively few in the rest of the region say there are strong
partisan conflicts in their society. Singaporeans feel particularly united
when it comes to politics; 17% say there are no conflicts at all. In many of the European countries surveyed, younger adults are more
likely than those ages 65 and older to say there are strong conflicts between
supporters of different political parties. Younger and older Greeks are
especially divided. Only 39% of Greeks ages 65 and older think there are
strong partisan tensions in their country, compared with 82% of Greeks ages
18 to 29. Similar, though smaller, differences can also be seen in Germany,
Belgium, Spain, Italy, the Netherlands and Sweden. Outside of Europe, a third
of older adults in Japan see their country as politically divided, compared
with roughly half of those under 30. Notably, there are very few differences by ideology or support for
the governing party. In the U.S., for example, Republicans and
Republican-leaning independents are just as likely as Democrats and
Democratic-leaning independents to think there are strong partisan tensions
in the U.S. (both 90%). There is a relatively strong correlation between perceptions of
partisan conflict among the general public and the views of experts (r=+0.72). In publics where larger shares
of survey respondents say there is tension between different party backers,
experts generally report greater political polarization (according to
the V-Dem political
polarization measure, which quantifies the extent to which trained coders
view each public as polarized into antagonistic political groups). Additionally, the share of people across the 17 publics surveyed who
say there are very strong conflicts between supporters of different political
parties is moderately correlated (r=+0.59)
with the share of seats received by the second-largest party in an election.
For example, in the 2020 election in Taiwan, the Democratic Progressive Party
(DPP) received 54% of the seats in Taiwan’s legislature while the Kuomintang
(KMT) – the second-largest party – received 34%, making for a relatively
divided chamber. Roughly three-in-ten in Taiwan say there are very strong
partisan conflicts in their society. Toward the other end of the spectrum,
one can look at Japan, where the ruling Liberal Democratic Party (LDP) won
59% of seats in the House of Representatives in the 2017 election, while the
second-largest party – the Constitutional Democratic Party (CDP) –received
just 11%. In Japan, a much smaller share of the public describes very strong
tensions between different party supporters (8%). Perceived conflict between people with
different ethnic or racial backgrounds Many people across the 17 advanced economies surveyed see strong
conflicts between people with different ethnic or racial backgrounds (a
median of 48%). People in the U.S. (71%), France (64%) and Italy (57%) are
particularly likely to view these tensions as strong, with around a quarter
in each country who say they are very strong.
While majorities in South Korea and Germany also say there are strong conflicts
in their society, only around one-in-ten rate them as very strong. In Sweden, Belgium and the Netherlands, people are more likely to say
there are strong conflicts between people from different ethnic or racial
backgrounds than between people who support different political parties. In
Sweden, for example, while only 35% see their country as politically divided,
50% see tensions based on race or ethnicity. In about half of the publics surveyed, women are more likely than men
to say that there is friction between people from different ethnic
backgrounds. For example, 49% of German men compared with 61% of German women
hold this view. Similar gender differences are seen in Belgium, France,
Greece, Italy, the Netherlands, New Zealand and Taiwan. Overall, there are few ideological differences. In Germany, Sweden
and Italy, those on the right of the ideological spectrum are more likely
than those on the left to see strong conflicts between people from different
racial and ethnic backgrounds. This pattern is reversed in Greece and the
U.S., with those on the left more likely to say that there are racial or
ethnic tensions in their countries. Consistent with the ideological differences in the U.S., Democrats
(82%) are much more likely than Republicans (58%) to say there are strong
conflicts based on race and ethnicity in their country. And Black Americans
(82%) see more conflict between people of different racial and ethnic
backgrounds than White (69%) and Hispanic Americans (70%). Perceived conflict between people who
practice different religions Overall, fewer people see strong religious conflicts, compared with
conflicts based on politics or race. A median of 36% across the 17 publics
surveyed say there are strong conflicts between people who practice different
religions in their society. South Korea and France are the only places surveyed where more than
half of people say there are strong divisions based on religious beliefs. And
in France, almost a quarter say these conflicts are very strong. Roughly half of Americans say there are strong conflicts between
people who practice different religions in their country, including 13% who
say there are very strong conflicts. In Europe, people in Spain are by far the least likely to say there
are strong religious tensions. Only 19% of Spaniards hold this view. More say
that there are no conflicts between different religious groups at all in
their country (30%). Again, South Korea is an outlier in the Asia-Pacific region. Koreans
are nearly twice as likely as those in Japan, which has the second-highest
share in the region, to say there are religious tensions in their country. In
contrast, roughly three-in-ten in Singapore and Taiwan say there are no
religious conflicts at all. Adults under 30 are more likely than those ages 65 and older to see
strong religious divisions in Greece, Belgium, Japan, Italy, the U.S., Spain
and Taiwan. And again, Greeks are the most polarized by age, with 60% of
younger adults and 24% of older adults saying there are strong conflicts
based on religion in their country. Different kinds of religious conflict The survey included two questions measuring perceived religious
conflict: 1) conflict between people who practice different religions and 2)
conflict between people who are religious and people who are not religious.
The separate questions were included to determine if people viewed tensions
between, for example, Christians and Muslims, as stronger or weaker than
conflicts between people who identify with a religion and those who do not. The differences between these two questions were negligible. In most
countries, similar shares say there are strong conflicts between people who
practice different religions and between those who are religious and those
who are not. Across the 17 publics surveyed, the correlation between the
questions was extremely high (r=+0.97).
Considering the similarities between the questions, we focus on just one for
our analysis: conflict between people who practice different religions. However, perceptions of religious conflict differ somewhat by
ideology in several countries. For example, conservatives in the U.S. are
more likely to see strong conflicts between people who are religious and
those who are not (50%) than between different religious groups (39%).
Liberals respond nearly the same to both questions. And in Sweden, people on
the left are less likely to see conflicts between people who are religious
and those who are not (12%) than between different religious groups (26%). In Germany, Canada and Italy, there are ideological divides in the
extent to which people see conflicts between those who are religious and
those who are not, with people on the right more likely to see conflicts than
those on the left. But people on the left and right in these countries agree
on the extent to which there are conflicts between different religious
groups. Perceived conflict between people who live
in cities and people who live in rural areas A median of just 23% say there are strong or very strong conflicts
between people who live in cities and people who live in rural areas. Half
say there are not very strong conflicts and 20% say there are no conflicts at
all between these groups. (Medians are based on 16 publics. This question was
not asked in Singapore, a geographically small island nation with an entirely
urban population.) Again, France, South Korea and the U.S. stand out as particularly
divided. Roughly 45% in each country say there are strong or very strong
tensions based on geography. Elsewhere, no more than three-in-ten share this
sentiment. Spaniards are the most likely to say that there are no conflicts at
all between those who live in cities and those who live in rural areas (49%).
In Europe, at least a quarter in Belgium, Italy and Greece say the same. Similarly, many in the Asia-Pacific region – with the exception of
South Korea – say there are not very strong or no conflicts based on what
type of area people live in. Roughly one-in-five or more in New Zealand,
Australia, Japan and Taiwan say there are no divisions at all between
city-dwellers and people who live in rural areas. People across the ideological spectrum tend to agree that there are
limited conflicts based on the type of area people live in. In the U.S.,
however, people on the left (53%) are more likely than those on the right
(38%) to say that there are strong or very strong conflicts between people
who live in urban areas and people who live in rural areas. In six European countries – Belgium, the UK, Germany, France, the
Netherlands and Greece – those with a secondary education or below are more
likely than people with postsecondary education to say that there is friction
based on where people live in their country. In the U.S., the opposite is
true; people with more education are more likely than those with less to say
there are strong conflicts between people in urban and rural areas. Majorities of some publics say most people
agree on basic facts A median of 39% believe there are fundamental disagreements over
basic facts in their society. In France and the U.S., about six-in-ten say
most people in their country disagree over basic facts, while half or more
also hold this view in Italy, Spain and Belgium. In contrast, roughly
two-thirds or more in New Zealand, the Netherlands, Australia, Canada and
Germany think most people agree on basic facts, even if they disagree about
policies. This high sense of disagreement over facts may be due, at least in
part, to struggles
to combat pandemic-related conspiracy
theories. In most places surveyed, those who believe COVID-19 has made
their society more divided are much more likely to say people disagree over
basic facts than those who say COVID-19 has made their society more united. Perception of political conflicts is strongly tied to whether adults
think their fellow citizens agree or disagree on basic facts. In every public
surveyed, those who say there are very strong or strong conflicts between
people who support different political parties are more likely to think
people disagree on basic facts. This divide is largest in Sweden: 62% of
Swedes who say there are political conflicts think most people disagree about
basic facts, compared with only 37% of Swedes who say there are not very
strong or no conflicts between people who support different political
parties.2 Views on the topic are closely related to views of the governing
party or parties in each place surveyed. Outside of the U.S. and Italy, in
every other public those with unfavorable views of the governing coalition
are more likely to say most people disagree about basic facts than those with
favorable views of the government. (PEW) OCTOBER 13, 2021 Source: https://www.pewresearch.org/global/2021/10/13/diversity-and-division-in-advanced-economies/ |
||||||||||||||||||||||||||||||||||||||||||||||||||||||||||||||||||||||||||||||||||||||||||||||||||||||||||||||||||||||||||||||||||||||||||||||||||||||||||||||||||||||||||||||||||||||||||||||||||||||||||||||||||||||||||||||||||||||||||||||||||||||||||||||||||||||||||||||||||||||||||||||||||||||||||||||||||||||||||||||||||||||||||||||||||||||||||||||||||||||||||||||||||||||||||||||||||||||||||||||||||||||||||||||||||||||||||||||||||||||||||||||||||||||||||||||||||||||||||||||||||||||||||||||||||||||||||||||||||||||||||||||||||||||||||||||||||||||||||||||||||||||||||||||||||||||||||||||||||||||||||||||||||||||||||||||||||||||||||||||||||||||||||||||||||||||||||||||||||||||||||||||||||||||||||||||||||||||||||||||||||||||||


 Percentage
of Parents Who Stated That They Would Accept PCR Testing to Their Children
37%


